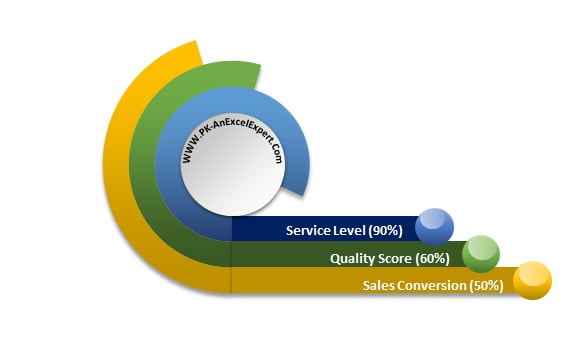
Enhance your reporting toolkit with our “Multilayered Doughnut Chart: Part-1” paid Excel file, specifically designed to display multiple KPI metrics simultaneously in an aesthetically pleasing and efficient manner. This tutorial will guide you through the creation of a sophisticated multilayered doughnut chart, ideal for use in business presentations and dashboards.
Key Features:
- Comprehensive Visualization: Learn to represent up to three or four KPI metrics in a single, easy-to-understand chart, allowing for comparative analysis and streamlined data presentation.
- Dynamic Customization: Follow step-by-step instructions on customizing chart elements such as doughnut hole sizes, slice angles, and fill options, including gradient fills that enhance visual impact.
- Practical Application: The file includes detailed tutorials on adding interactive features like connected text boxes and dynamic data labels that automatically update with your data, making it a practical choice for real-world business scenarios.
Read the detailed blog post