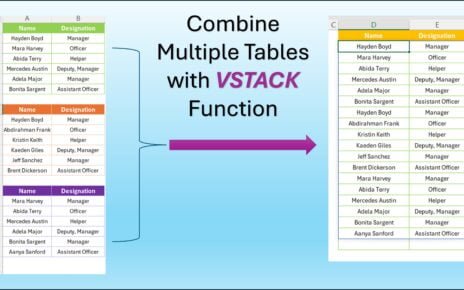
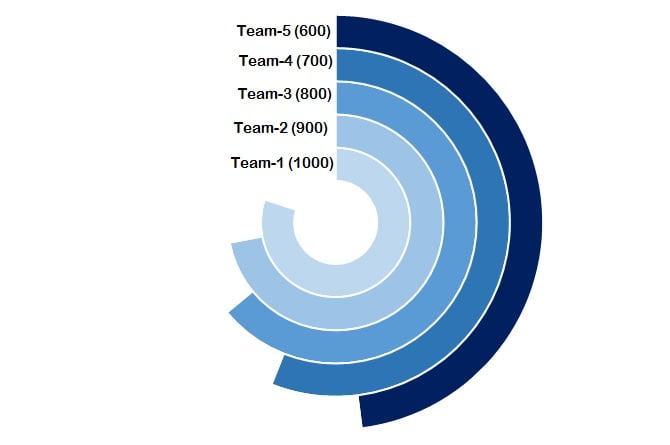
Dive deeper into sophisticated data visualization with Part-2 of our Multilayered Doughnut Chart series. This tutorial will guide you through the process of creating an intricate, multi-layered doughnut chart that effectively displays team-level performance. Ideal for business dashboards or presentations, this chart is designed to visually compare the performance of 5 to 6 teams simultaneously.
Key Features:
- Multi-Layer Visualization: Create a visually striking doughnut chart with multiple layers, allowing for a comprehensive overview of team performances in one glance.
- Dynamic Data Integration: Learn to implement formulas that automatically adjust the chart as your data changes, ensuring your visualizations are always up-to-date.
- Customization Techniques: Detailed instructions on customizing the doughnut chart’s color schemes, hole size, and data labels to fit your presentation or dashboard aesthetics.
- Interactive Elements: Incorporate linked text boxes for dynamic data labels that update automatically, enhancing the interactivity of your chart.
Read the detailed blog post