The Music Industry KPI Dashboard in Power BI is a powerful tool designed to help music professionals track key performance indicators with ease. This ready-to-use dashboard captures data from an Excel file and visualizes crucial metrics like streaming performance, ticket sales, and fan engagement. With its interactive insights and real-time tracking, this dashboard enables better decision-making for record labels, artists, and music managers.
Key Features of the Music Industry KPI Dashboard
Summary Page
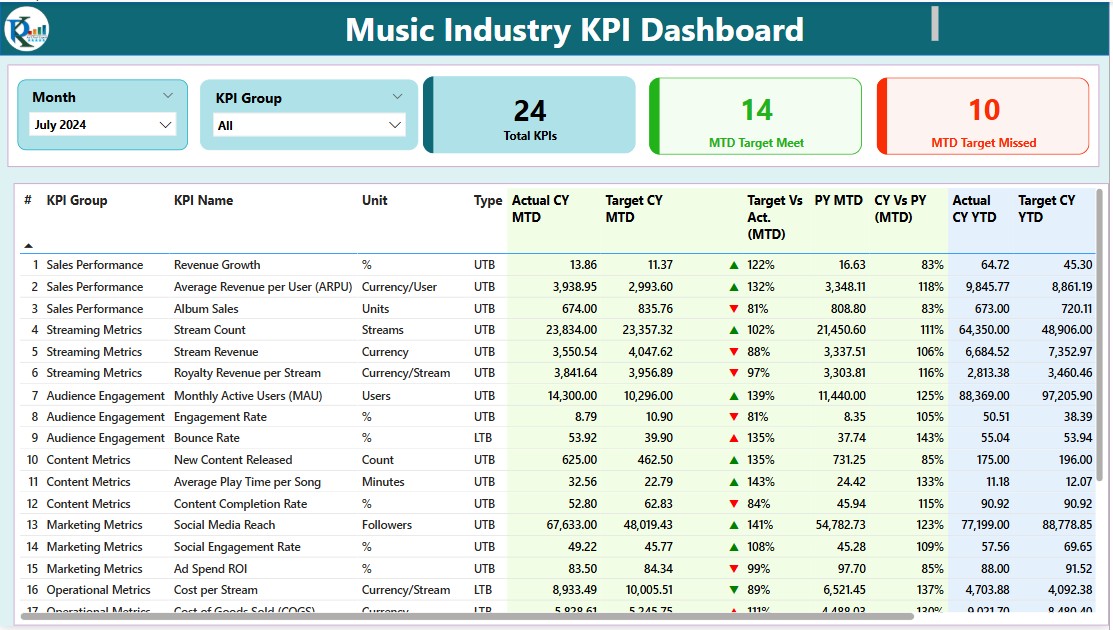
- Provides a high-level overview with slicers for Month and KPI Group. Displays Total KPIs count, MTD Target Met, and MTD Target Missed. Includes a detailed table with KPI-specific metrics such as Actual vs. Target comparisons and performance icons.
KPI Trend Page
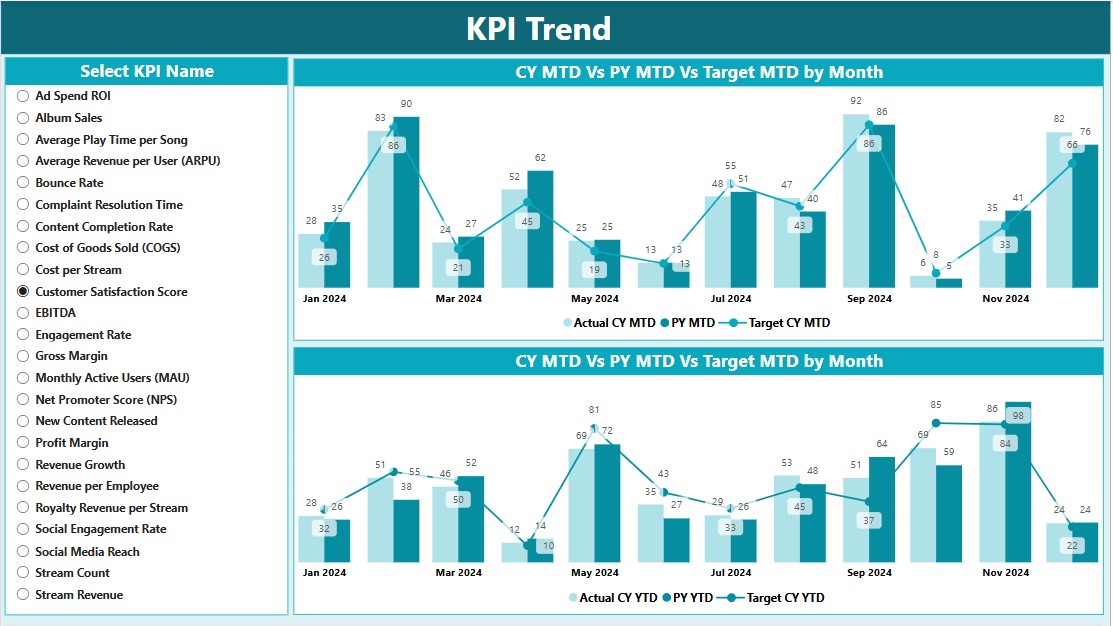
- Features two combo charts that display actual vs. target numbers for MTD and YTD performance. A slicer allows users to select and analyze specific KPIs.
KPI Definition Page
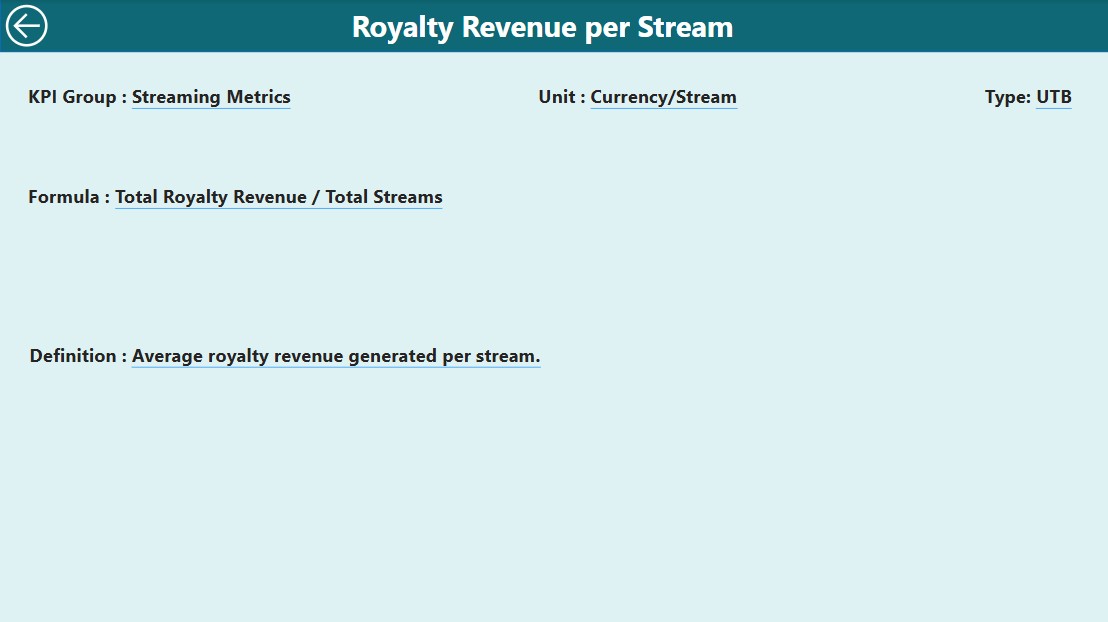
- A hidden drill-through page providing detailed KPI descriptions, formulas, and definitions. Easily accessible from the Summary Page for deeper insights.
Excel Data Integration
- Data is captured from an Excel file with three input sheets:
Actual Input Sheet – Users enter MTD and YTD actual values.
Target Input Sheet – Users input MTD and YTD target values.
KPI Definition Sheet – Stores KPI name, category, unit, type, and formula.