The Operations KPI Dashboard is a powerful Excel tool designed to help organizations monitor, analyze, and enhance operational performance. With this dashboard, teams can make data-driven decisions, streamline processes, and achieve long-term operational goals efficiently.
Key Features of the Operations KPI Dashboard:
- Home Sheet: Acts as a centralized navigation panel with clickable links, providing easy access to each section of the dashboard.
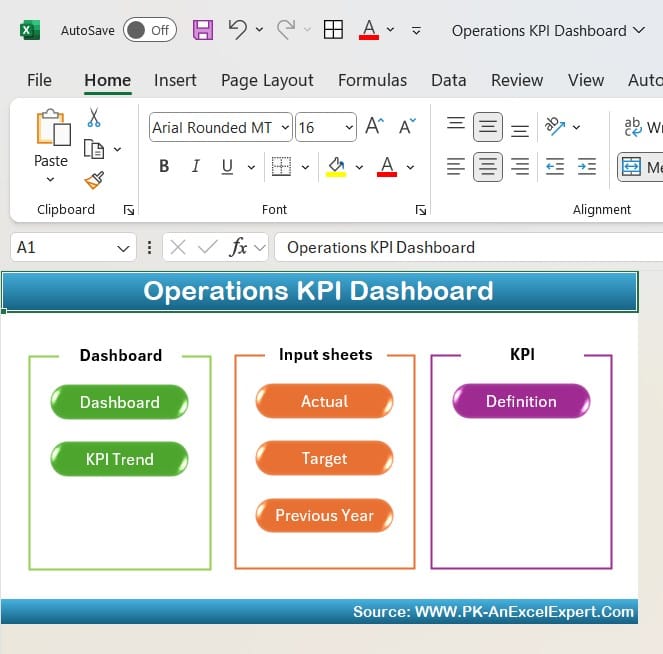
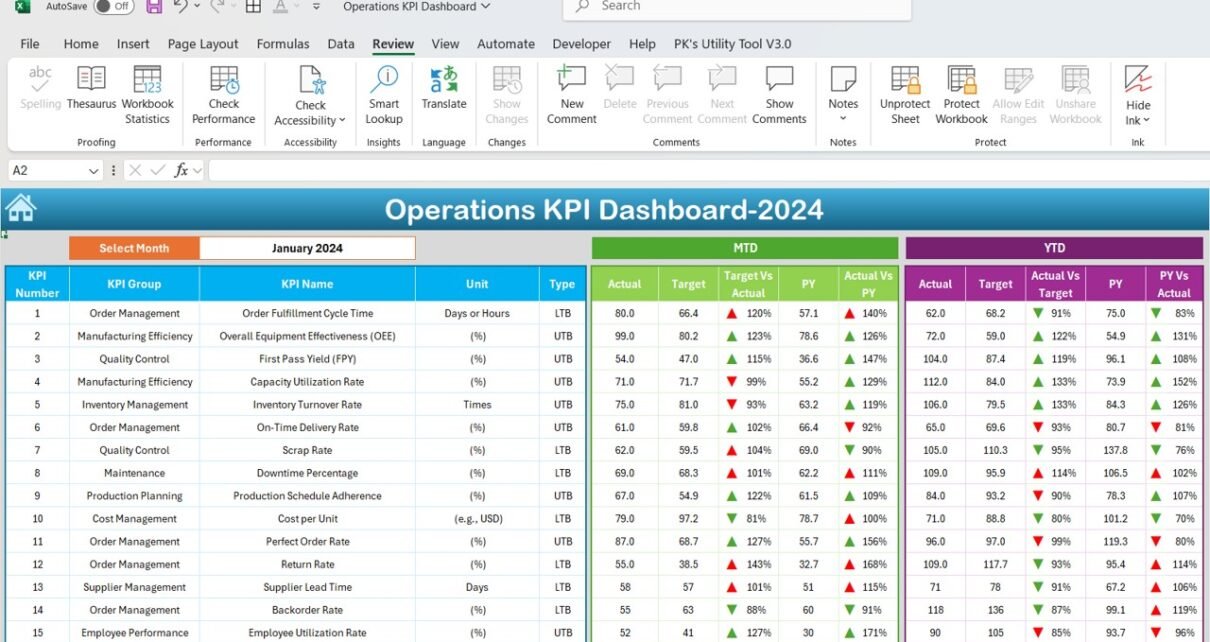
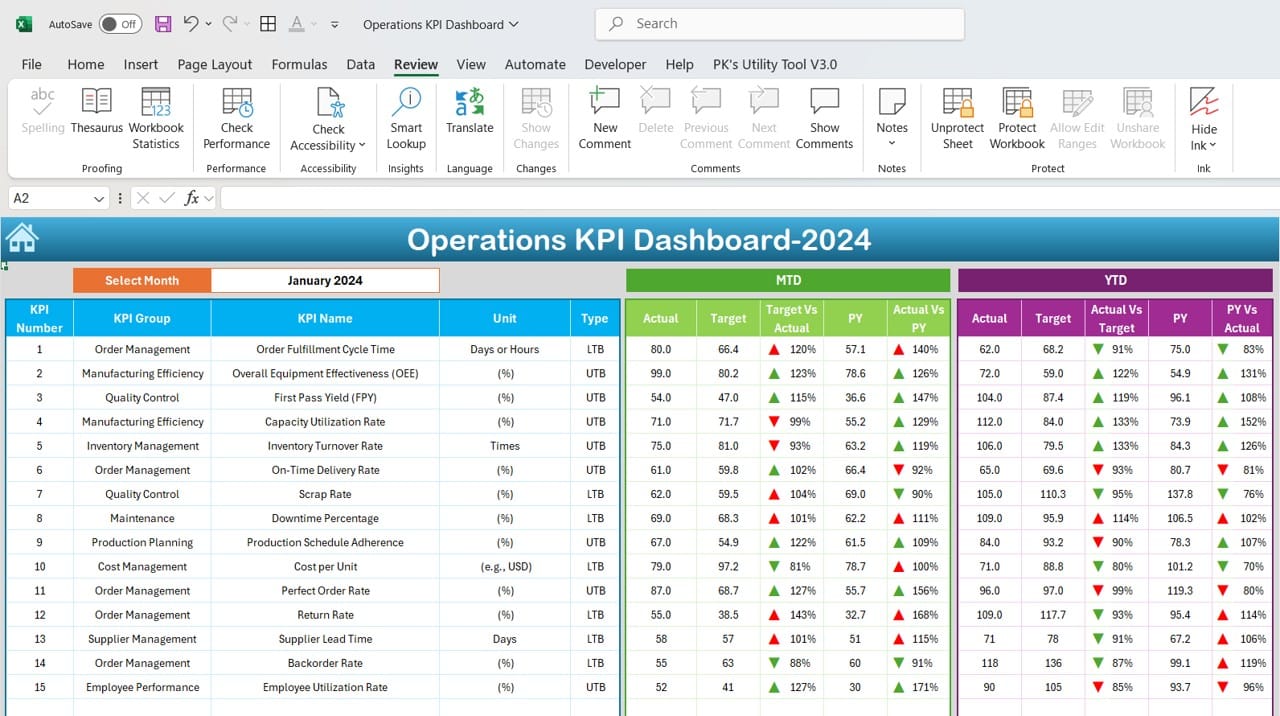
- Dashboard Sheet: Offers a dynamic summary of all KPIs with monthly and yearly data, using conditional formatting for quick performance insights.
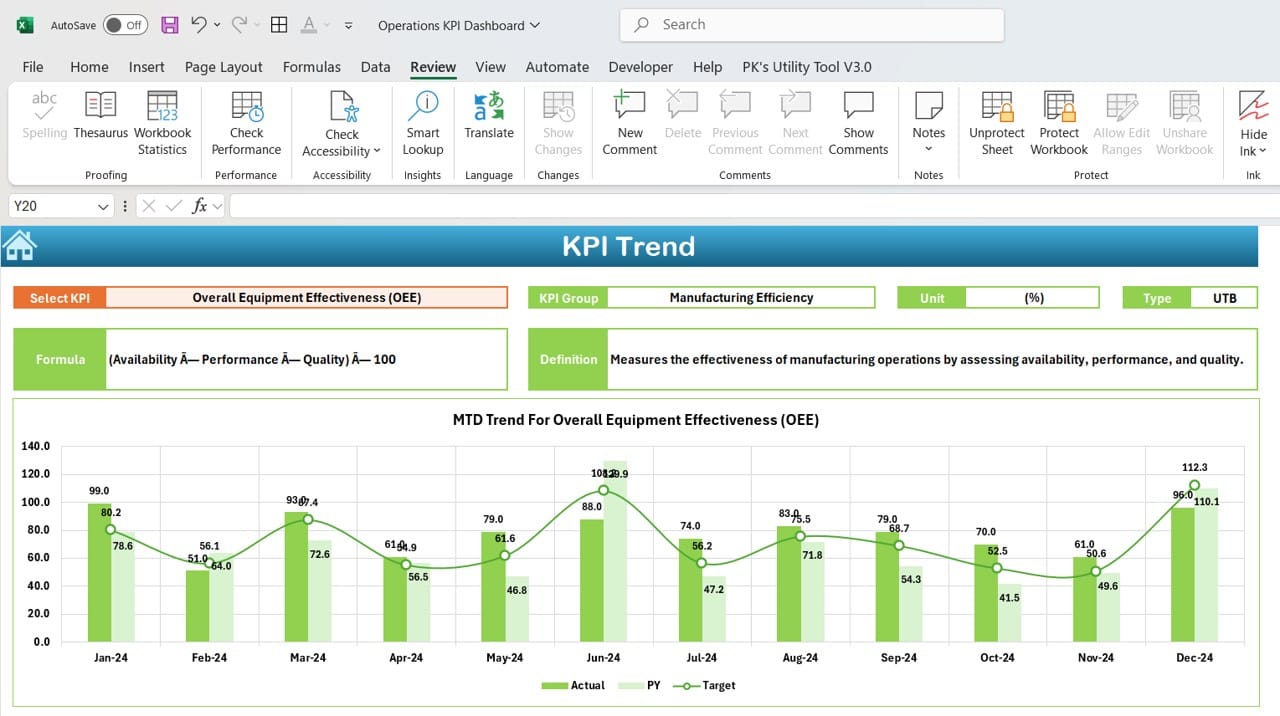
- KPI Trend Sheet: Enables detailed KPI analysis, showing metrics such as type, formula, and definitions to facilitate understanding.
- Actual and Target Sheets: Track actual monthly and yearly performance values and set target benchmarks for each KPI.
- Previous Year Data: Stores historical data to provide context for year-over-year comparisons, helping identify trends.
- KPI Definition Sheet: Outlines each KPI’s purpose, unit, and formula, ensuring team alignment and clarity.