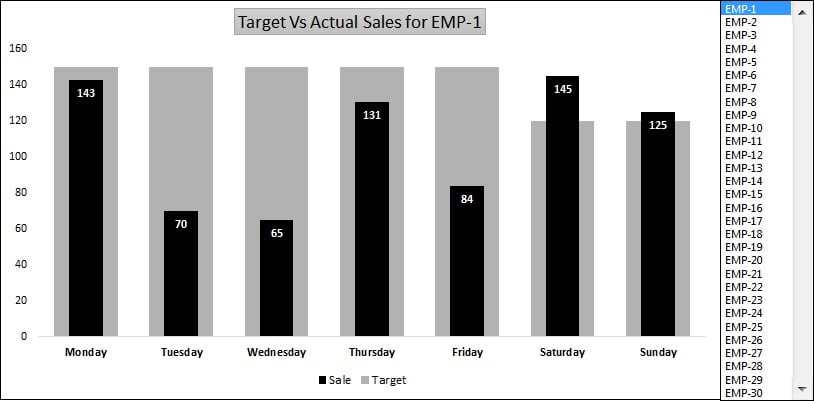
Target Vs Actual Sales Dynamic Chart
Elevate your sales management with our Target Vs Actual Sales Dynamic Chart Excel Template. This innovative tool is specifically designed to track and compare the sales performance of individual team
Transforming Data into Decisions