Rev up your data presentation with the "
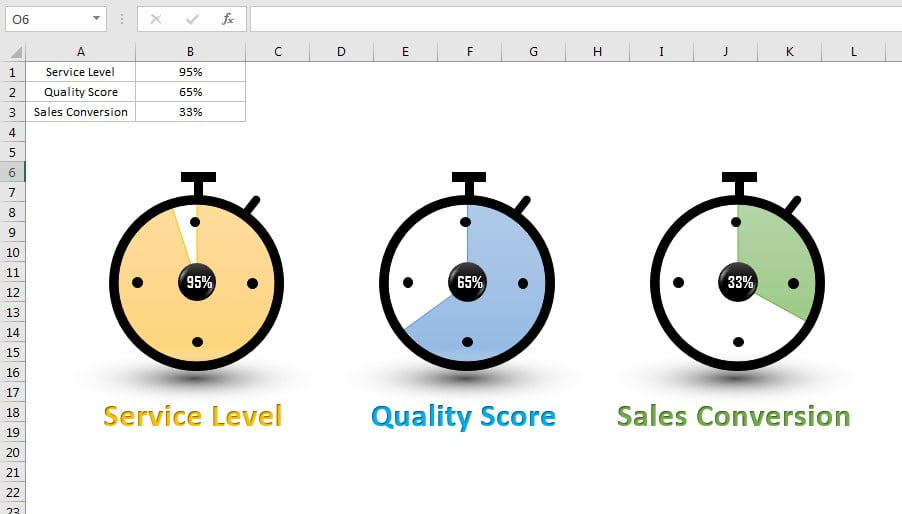
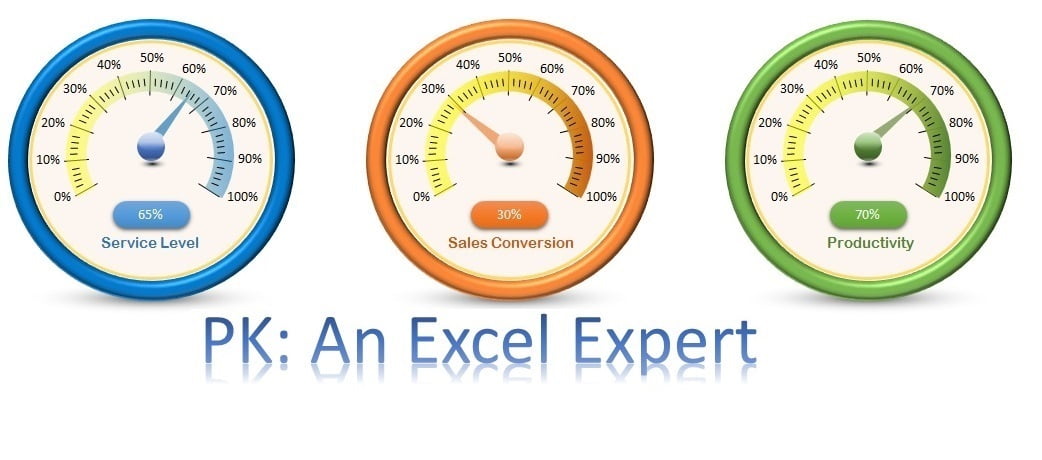
Ultimate Speedometer in Excel," a powerful visual tool meticulously crafted to display performance metrics dynamically. Unlike traditional charts, this custom speedometer uses auto-shapes
PKComments Off on Highlight the Specific data point in a Line Chart Dynamically
Elevate your business dashboards and presentations with our innovative Excel Line Chart, designed to dynamically highlight specific data points such as Minimum, Maximum, and Selected values. This powerful tool provides
PKComments Off on An Innovative chart for team level performance
Unveil the power of team performance visualization with our Innovative Chart for Team Level Performance in Excel. Crafted meticulously with a Line with Marker chart, this tool is designed to
Revitalize your data presentations with our "Infographics with Line Chart" Excel file, a transformative approach to traditional line charts. By integrating vibrant infographics, such as custom icons and illustrations, this
Discover the enhanced capabilities of our Slide Meter Chart (Version-3), the latest iteration in our series of Excel-based visualization tools. This version integrates advanced conditional formatting to provide immediate visual
Elevate your KPI reporting with our Slide Meter Chart - Version 1, a meticulously designed Excel tool that combines aesthetics with functionality. This innovative chart utilizes a combination of column
PKComments Off on Timer Chart Visualization in Excel
A beautiful data-driven Timer Chart visualization. This chart is perfect for displaying KPI metrics such as Service Level, Quality Score, and Sales Conversion. Using Excel Shapes and a Pie Chart,
PKComments Off on Stylish Butterfly Chart – Version 1
Introducing the "Stylish Butterfly Chart - Version 1," an innovative Excel visualization tool designed to compare the performance of two teams across various key performance indicators (KPIs). This visually striking
PKComments Off on Innovation: Focus Chart in Excel
Unlock the full potential of performance tracking with our "Innovation: Focus Chart in Excel," a creative tool designed to spotlight top performers dynamically. This chart features a unique visual element—a
PKComments Off on Dynamic Conditional Formatting in Excel
Dynamic Conditional Formatting in Excel using Form Control Option Buttons. This advanced technique allows you to change Conditional Formatting styles, such as Heat Map, Data Bar, and Traffic Lights, based
This website uses cookies to improve your user experience, analyze site traffic and serve targeted ads in accordance with our Privacy PolicyACCEPT
Privacy & Cookies Policy
Privacy Overview
This website uses cookies to improve your experience while you navigate through the website. Out of these cookies, the cookies that are categorized as necessary are stored on your browser as they are essential for the working of basic functionalities of the website. We also use third-party cookies that help us analyze and understand how you use this website. These cookies will be stored in your browser only with your consent. You also have the option to opt-out of these cookies. But opting out of some of these cookies may have an effect on your browsing experience.
Necessary cookies are absolutely essential for the website to function properly. This category only includes cookies that ensures basic functionalities and security features of the website. These cookies do not store any personal information.
Any cookies that may not be particularly necessary for the website to function and is used specifically to collect user personal data via analytics, ads, other embedded contents are termed as non-necessary cookies. It is mandatory to procure user consent prior to running these cookies on your website.