The 
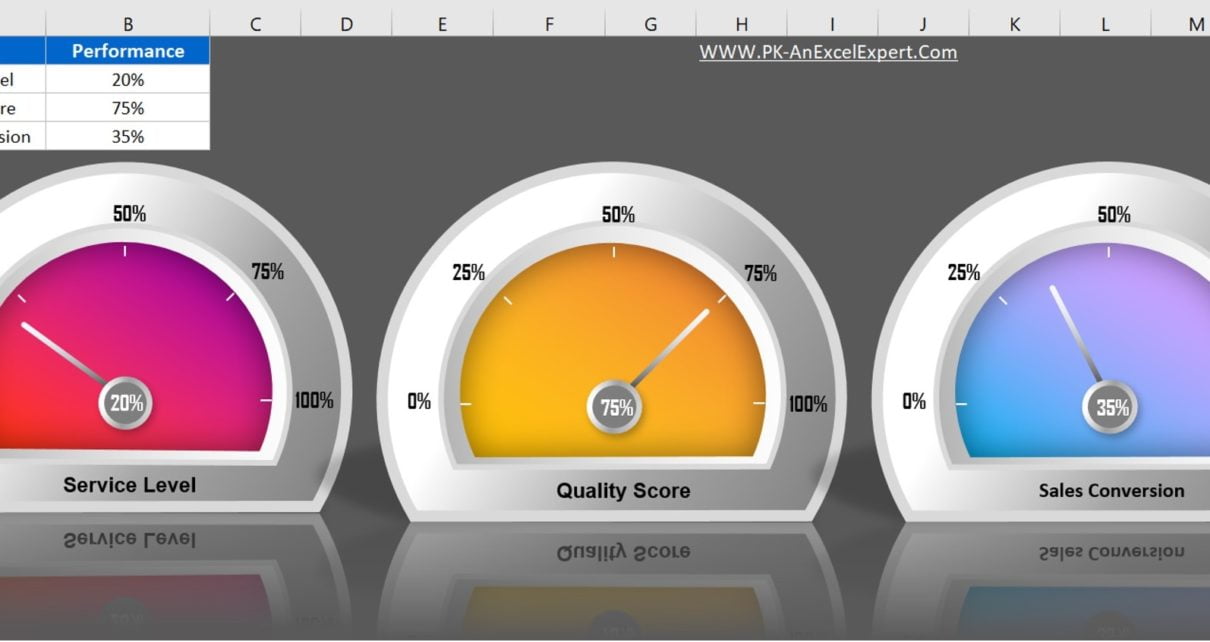
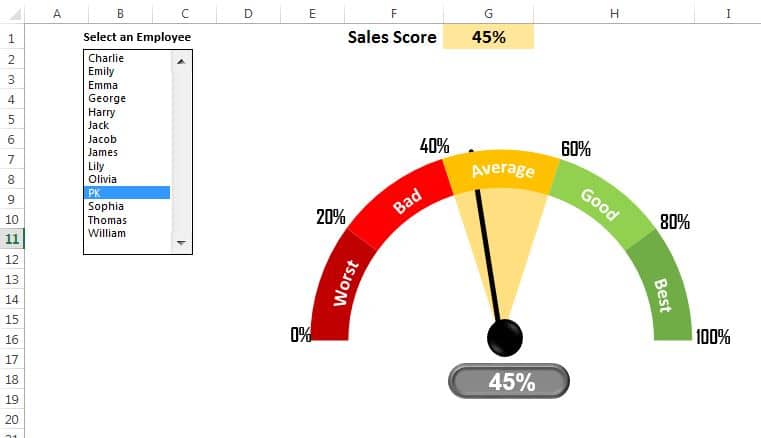
Dynamic Sales Score Meter Chart is a powerful tool designed to visually track and assess sales performance. This chart features a speedometer-style gauge, allowing you to see employee sales
PKComments Off on Sales Dashboard Power View in Excel 2013
The Sales Dashboard Power View in Excel 2013 offers a visually stunning and interactive way to analyze sales data. Utilizing Power View, this dashboard brings your data to life with
The "Yesterday Vs Today Sales Chart" Excel file helps you visualize daily sales comparisons with an intuitive and dynamic chart. Using up and down arrows, this chart highlights the sales
PKComments Off on Dynamic Performance Chart in Excel
Introducing our "Dynamic Performance Chart in Excel" file, where you'll learn how to create visually stunning and interactive performance charts using Excel shapes, Doughnut Charts, and Form control option buttons.
PKComments Off on Fully dynamic chart in Excel with Scroll bar and Spin button
Introducing the "Fully Dynamic Chart in Excel with Scroll Bar and Spin Button" file, a powerful tool designed to elevate your data analysis and visualization skills. This guide will teach
PKComments Off on 5 Layered Advanced Doughnut Chart
Introducing the "5 Layered Advanced Doughnut Chart" file, designed to help you create visually stunning and highly informative charts. This advanced charting technique allows you to display KPI values up
Introducing the 3D Gauge Chart in Excel, a stunning way to visualize key metrics and performance indicators. This chart utilizes Excel shapes and pie charts to create an eye-catching 3D
Introducing the Progress Bar Chart in Excel, a versatile chart to visually represent completion percentages or other key metrics. This chart is ideal for displaying Service Level, Productivity, and Sales
PKComments Off on Beautiful 3D Visualization in Excel
Unlock the power of stunning 3D visualizations in Excel with our comprehensive guide! This paid Excel file will help you create dynamic 3D charts using column charts and Excel shapes,
PKComments Off on Multicolor Filling Bars in Excel Cells Without using Chart
Multicolor Filling Bars in Excel Cells Template Enhance your data visualization effortlessly with our ready-to-use Excel template: Multicolor Filling Bars in Excel Cells Without Using Charts. Perfect for displaying project
This website uses cookies to improve your user experience, analyze site traffic and serve targeted ads in accordance with our Privacy PolicyACCEPT
Privacy & Cookies Policy
Privacy Overview
This website uses cookies to improve your experience while you navigate through the website. Out of these cookies, the cookies that are categorized as necessary are stored on your browser as they are essential for the working of basic functionalities of the website. We also use third-party cookies that help us analyze and understand how you use this website. These cookies will be stored in your browser only with your consent. You also have the option to opt-out of these cookies. But opting out of some of these cookies may have an effect on your browsing experience.
Necessary cookies are absolutely essential for the website to function properly. This category only includes cookies that ensures basic functionalities and security features of the website. These cookies do not store any personal information.
Any cookies that may not be particularly necessary for the website to function and is used specifically to collect user personal data via analytics, ads, other embedded contents are termed as non-necessary cookies. It is mandatory to procure user consent prior to running these cookies on your website.