
Managing pension funds effectively requires real-time tracking and performance measurement of key financial indicators. Our Pension Fund KPI Dashboard in Excel is a ready-to-use and fully automated tool designed for pension fund managers, financial analysts, and investment professionals. This dashboard simplifies fund monitoring by offering a data-driven approach to track, analyze, and visualize KPIs with ease.
Key Features of the Pension Fund KPI Dashboard
User-Friendly Navigation
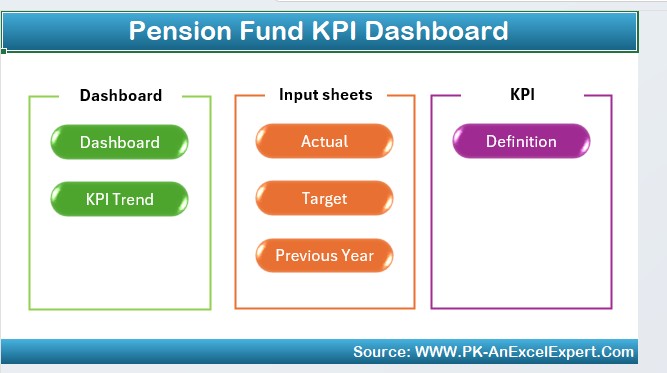
- A Home Sheet with six navigation buttons for seamless access to different sheets.
Comprehensive KPI Dashboard
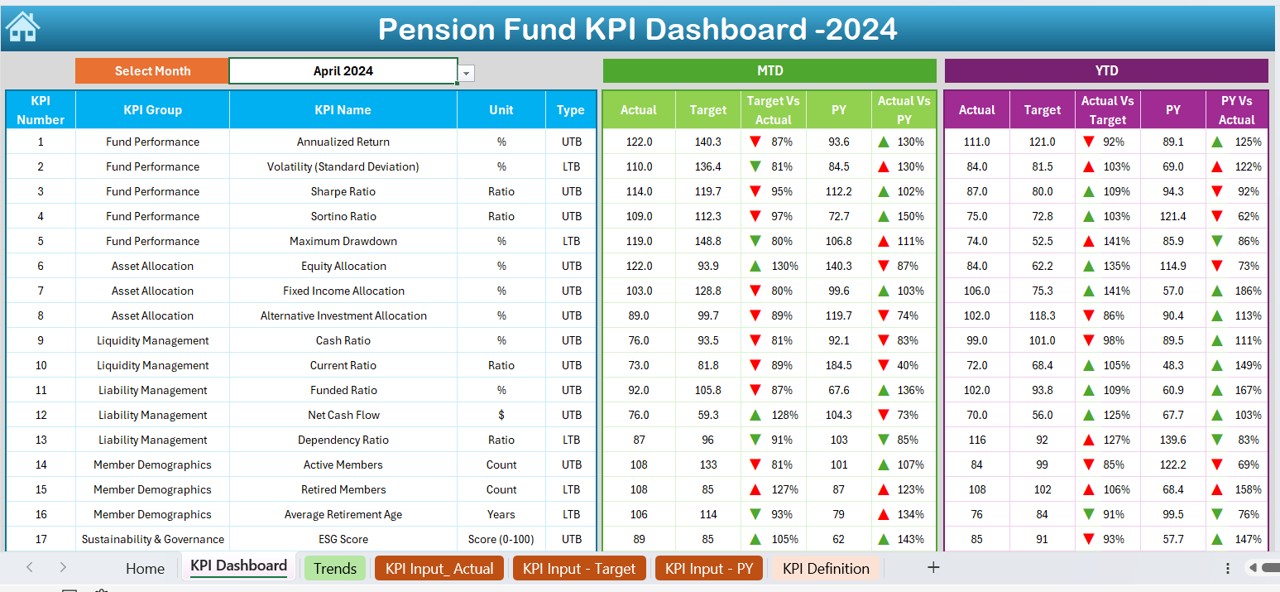
- A main Dashboard Sheet to visualize MTD and YTD performance, comparing actual vs. target vs. previous year values.
- Conditional formatting with up/down arrows for instant performance insights.
KPI Trend Analysis
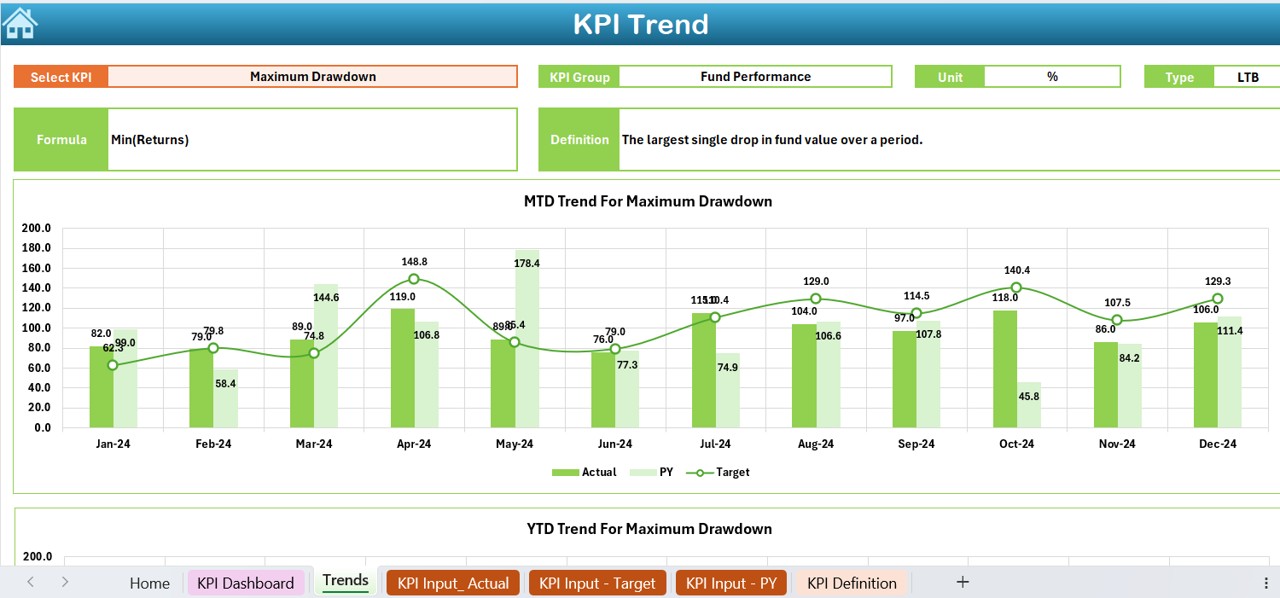
- Select a KPI from a dropdown and view unit, performance type, formula, and definition.
- Displays MTD and YTD trends with comparison charts.
Automated Data Input
- Actual Numbers Input Sheet for MTD and YTD entries with dynamic month selection.
- Target and Previous Year Sheets to store goal-based and historical data.
Custom KPI Definitions
- A dedicated KPI Definition Sheet to define, modify, and update KPIs with formulas and descriptions.

