The Performance Appraisal KPI Dashboard in Excel is a ready-to-use template designed to help businesses track and evaluate employee performance effectively. This dashboard provides a structured approach to monitoring KPIs, enabling HR professionals and managers to analyze trends, set performance benchmarks, and make data-driven decisions. With automated calculations, dynamic charts, and an intuitive interface, this Excel dashboard simplifies the performance review process.
Key Features of the Performance Appraisal KPI Dashboard
Home Sheet
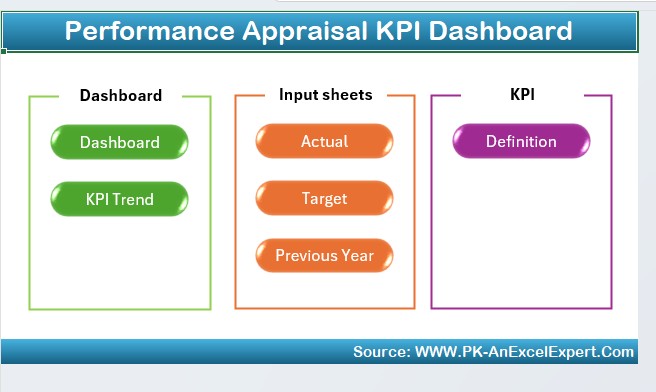
- Acts as an index sheet with 6 navigation buttons for quick access to different sections.
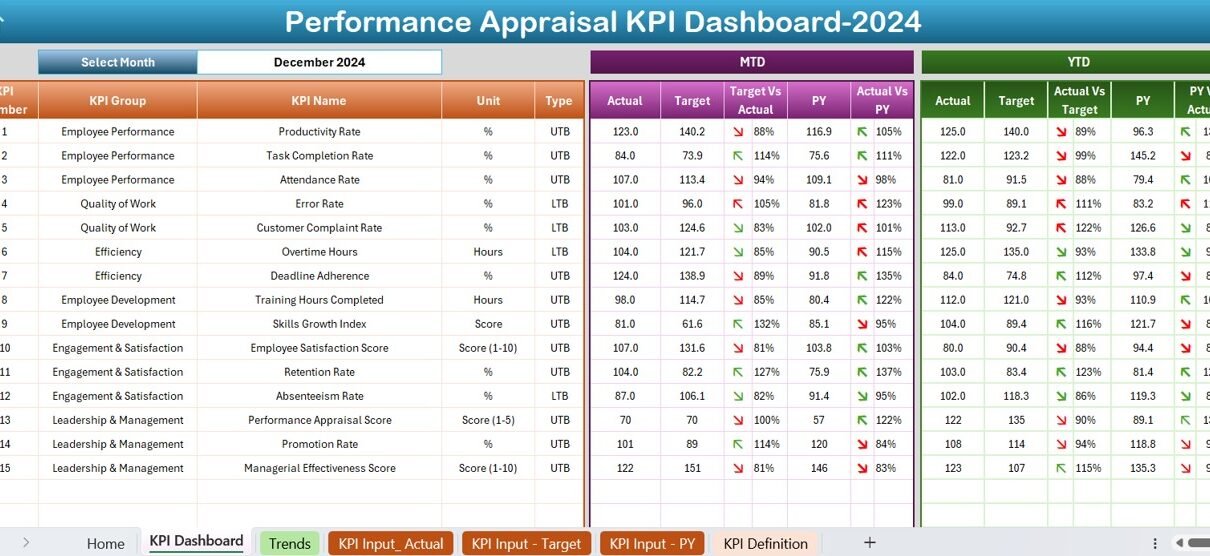
Dashboard Sheet Tab
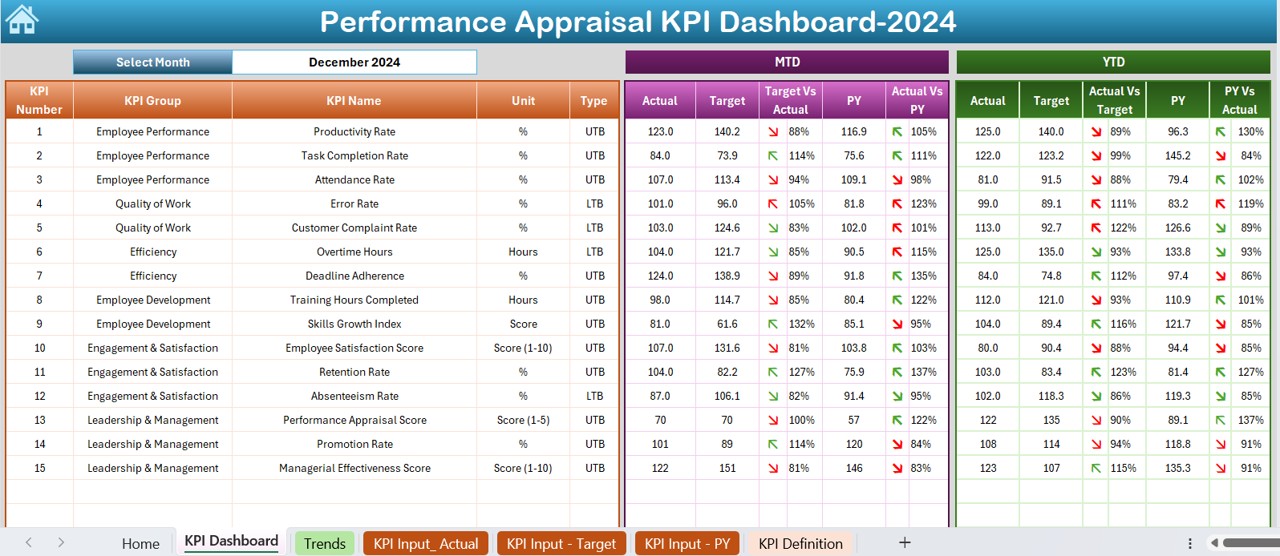
- Displays MTD (Month-to-Date) and YTD (Year-to-Date) performance data.
- Allows users to select a month from the drop-down in D3 to view updated metrics.
- Includes Target vs Actual and Previous Year vs Actual comparisons with conditional formatting and up/down arrows.
KPI Trend Sheet Tab
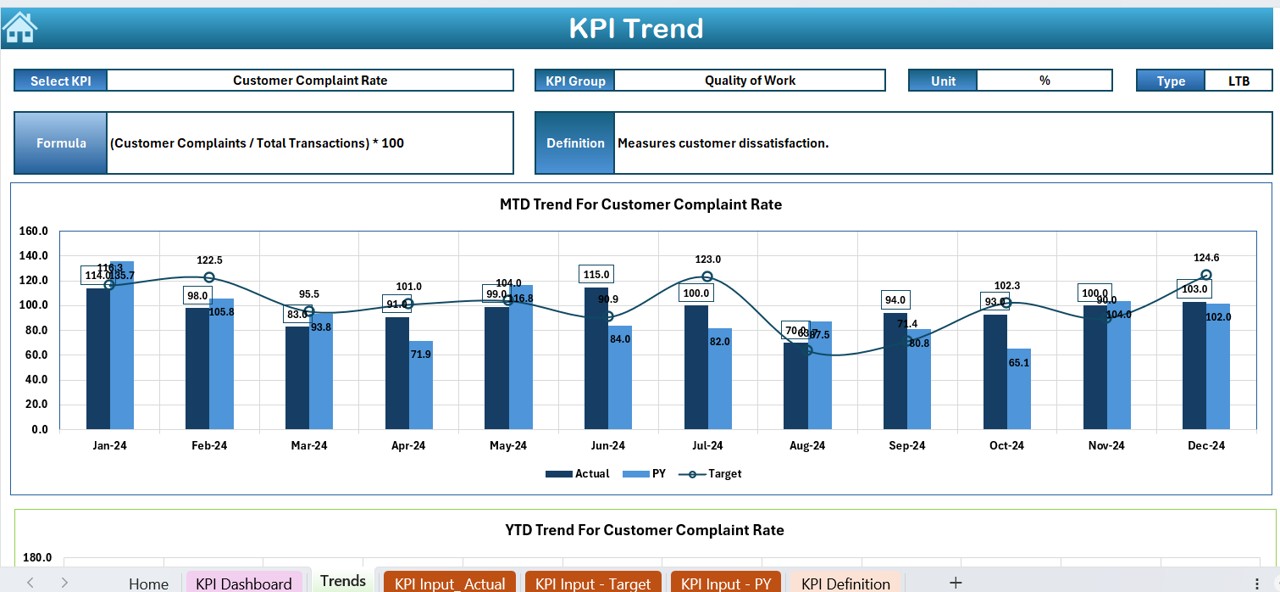
- Enables users to select a KPI from a drop-down in C3 to analyze trends.
- Displays KPI Group, Unit, KPI Type (Lower/Upper is Better), Formula, and Definition.
- Provides MTD and YTD trend charts for Actual, Target, and Previous Year values.
Actual Numbers Input Sheet
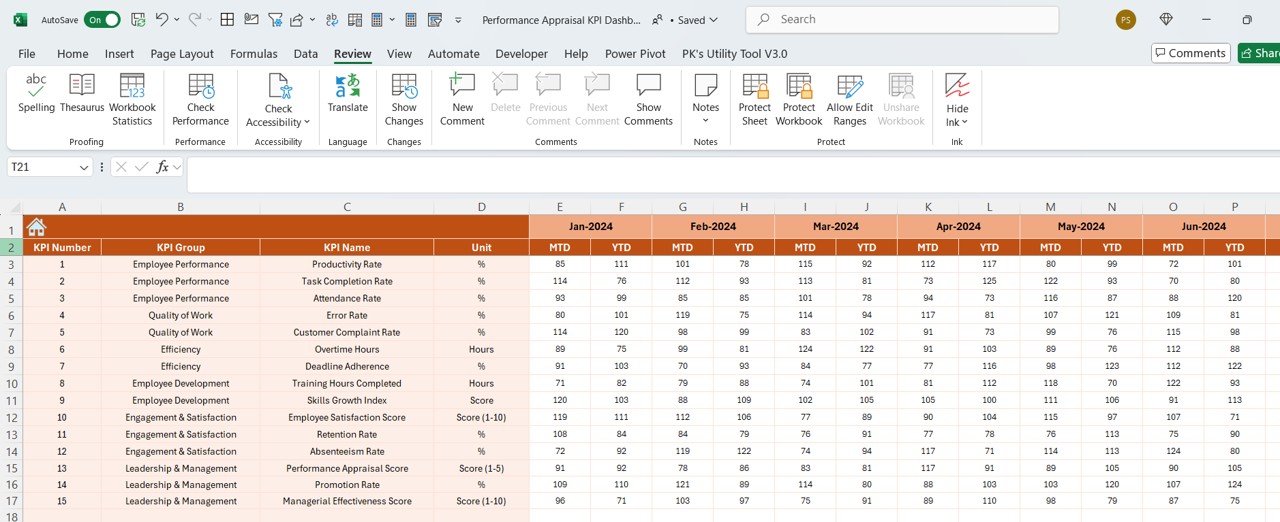
- Users enter actual performance data for both MTD and YTD.
- The first month of the year is defined in E1, allowing automatic adjustments.
Target Sheet Tab
- Users enter MTD and YTD target values for each KPI.
Previous Year Number Sheet Tab
- Stores previous year’s MTD and YTD data for comparative analysis.
KPI Definition Sheet Tab
- Includes KPI Names, Groups, Units, Formulas, and Definitions for easy reference.