Unlock the power of performance tracking with our Preschool KPI Dashboard in Excel, a meticulously crafted tool designed to streamline the management of key performance indicators in early childhood education settings. This ready-to-use template is tailor-made for educators and administrators who are committed to fostering operational excellence and educational success.
Key Features of the Preschool KPI Dashboard:
Comprehensive Worksheets:
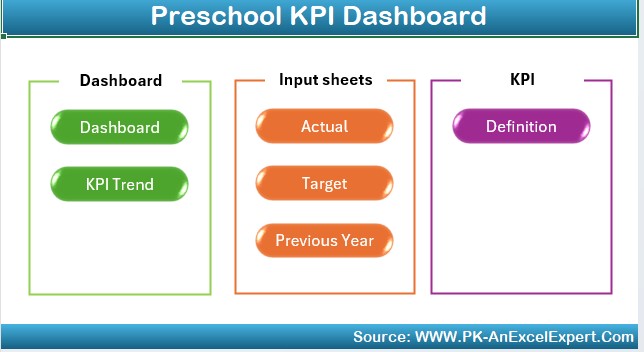
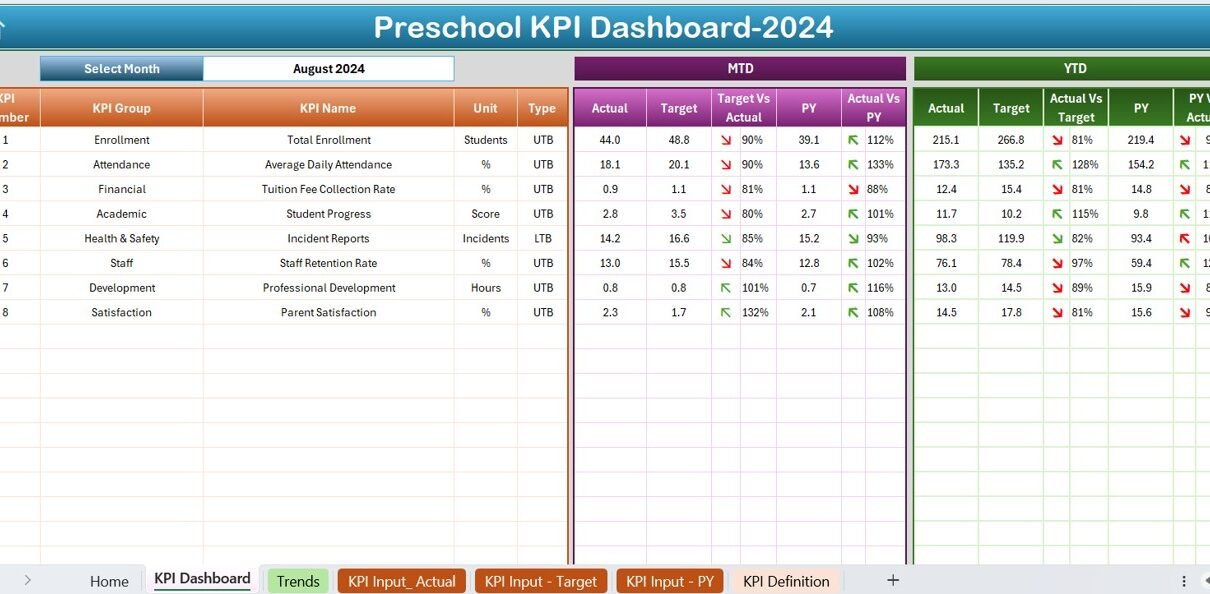
- The dashboard contains seven distinct worksheets, including a Home sheet with quick navigation buttons, a Dashboard sheet for an in-depth display of all KPIs with monthly selectivity, and specialized tabs for trend analysis, data input, and definitions.
Dynamic Data Interaction:
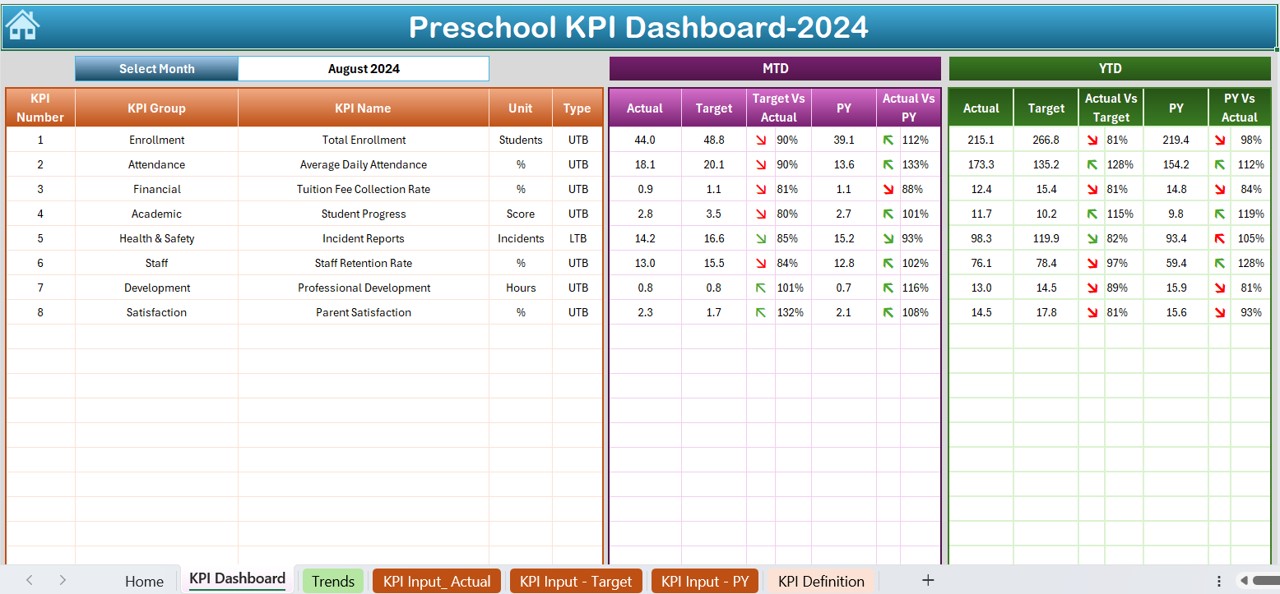
- Engage with real-time data adjustments by selecting different months or KPIs from dropdown menus, enhancing the usability and responsiveness of your managerial decisions.
Visual Performance Indicators:
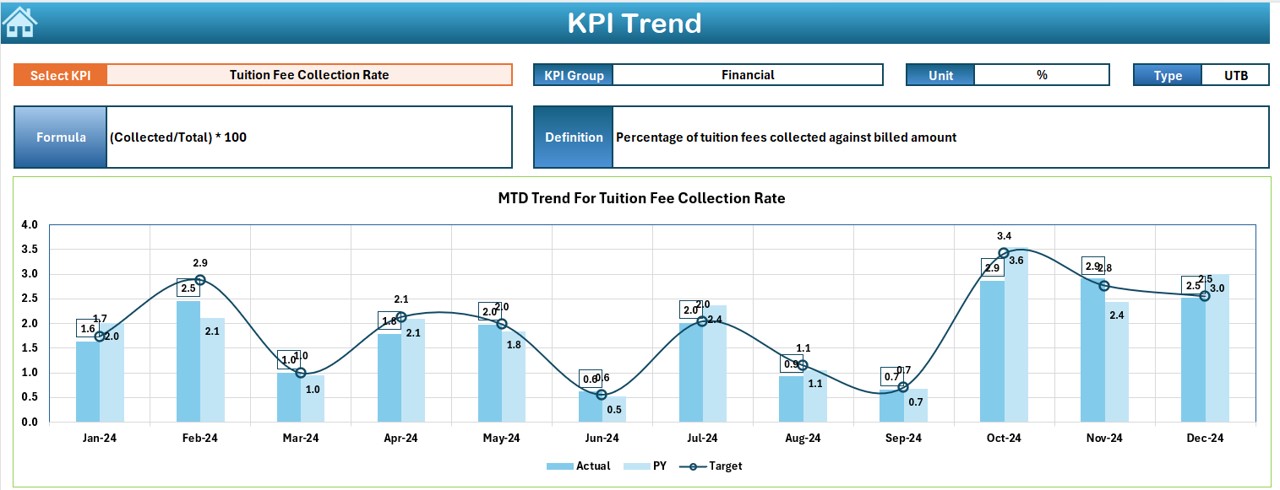
- Experience at-a-glance insights with MTD and YTD data comparisons, featuring conditional formatting to visually denote performance against targets and previous year’s data, ensuring easy interpretation and immediate action.