The Printing & Publishing KPI Dashboard in Power BI is a ready-to-use solution designed to help businesses in the printing and publishing industry monitor and evaluate their key performance indicators (KPIs) with precision. This dashboard captures data from an Excel file and transforms it into interactive visuals, enabling insightful decision-making and streamlined performance tracking.
Key Features
Three Comprehensive Pages:
Summary Page:
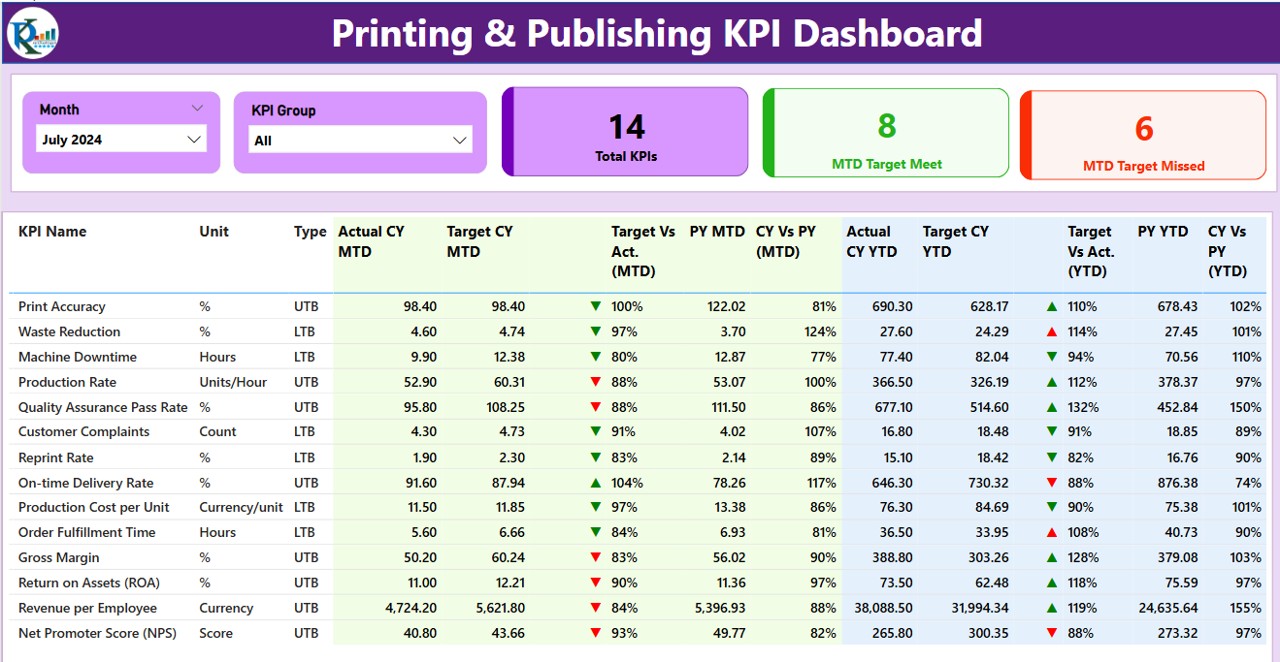
- Provides an overview of KPIs with slicers for Month and KPI Group. Displays key metrics like Total KPIs Count, MTD Target Met/Missed counts, and a detailed KPI table featuring performance comparisons and indicators.
KPI Trend Page:
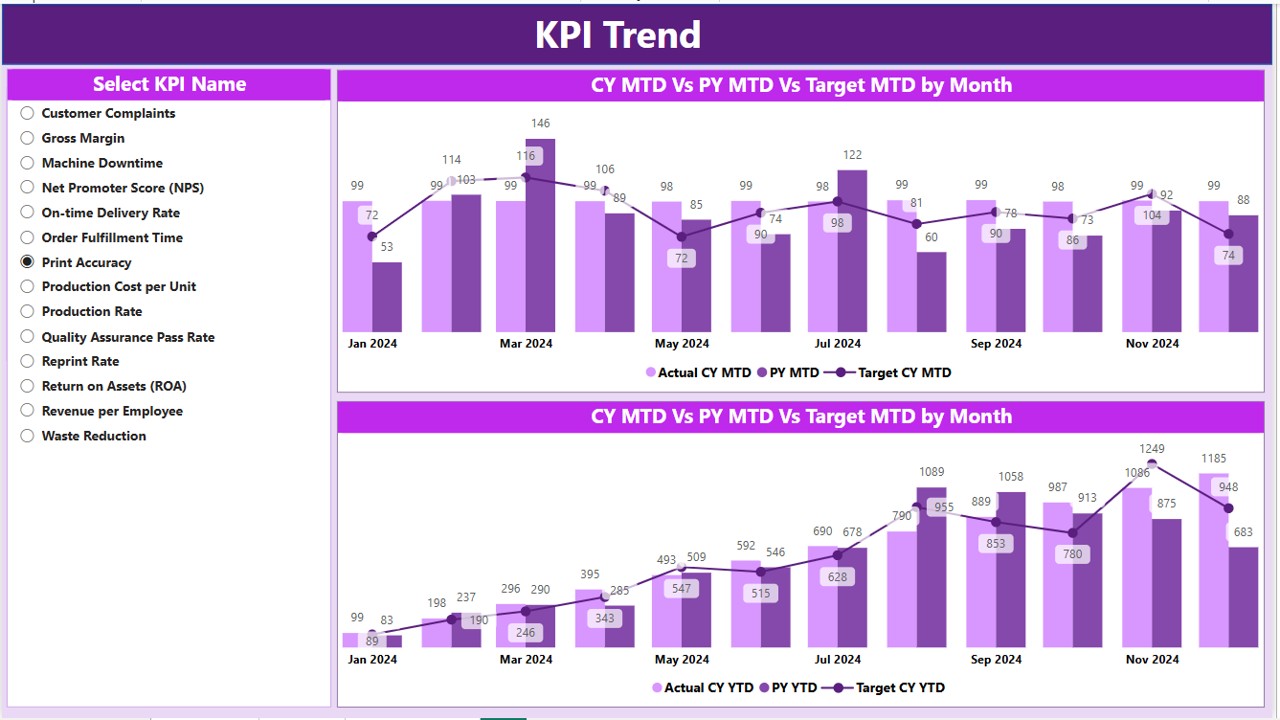
Showcases combo charts for MTD and YTD trends, comparing Actual Numbers, Previous Year performance, and Targets. Includes a slicer for KPI-specific analysis.
KPI Definition Page:
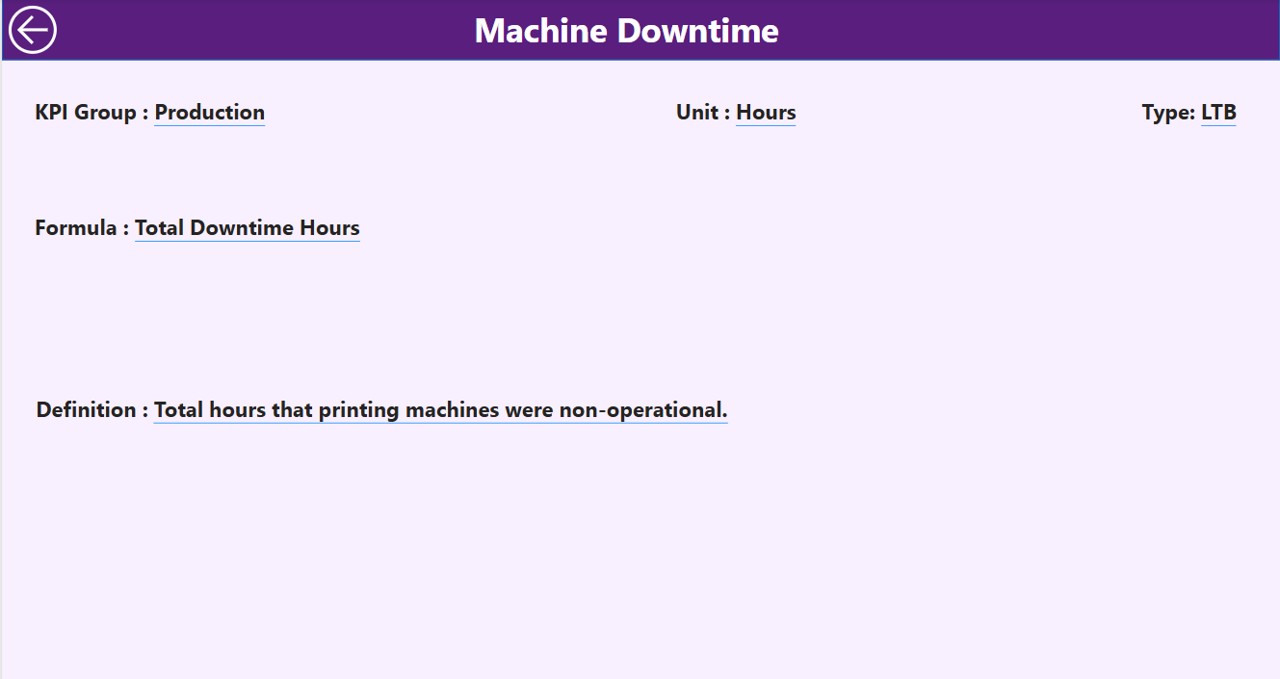
- A hidden drill-through page offering detailed KPI formulas and definitions, accessible via a back button for seamless navigation.
Excel Data Integration:
- Input Actual and Target data for MTD and YTD in predefined Excel sheets.
- Define KPIs with essential details like KPI Number, Name, Group, Unit, Type, and Formulas in a structured worksheet.
Interactive Visual Indicators:
- Intuitive ▲ (green) and ▼ (red) icons highlight KPI performance against targets for both MTD and YTD metrics.
Dynamic Slicers and Filters:
- Customize views based on time periods or specific KPI groups to focus on relevant data effortlessly.