Our Private Equity KPI Dashboard in Excel is a powerful, ready-to-use template designed to streamline your private equity performance tracking. This tool consolidates essential KPIs into one dynamic dashboard, allowing you to monitor Month-to-Date (MTD), Year-to-Date (YTD), and previous year comparisons effortlessly.
Key Features:
Home Sheet:
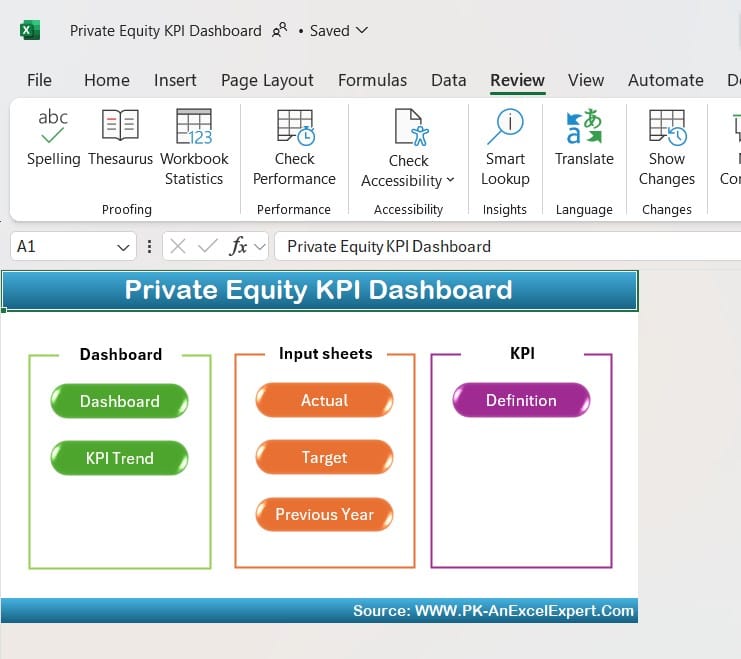
An easy-to-navigate index sheet with quick access buttons to each dashboard section.
Dashboard Sheet:
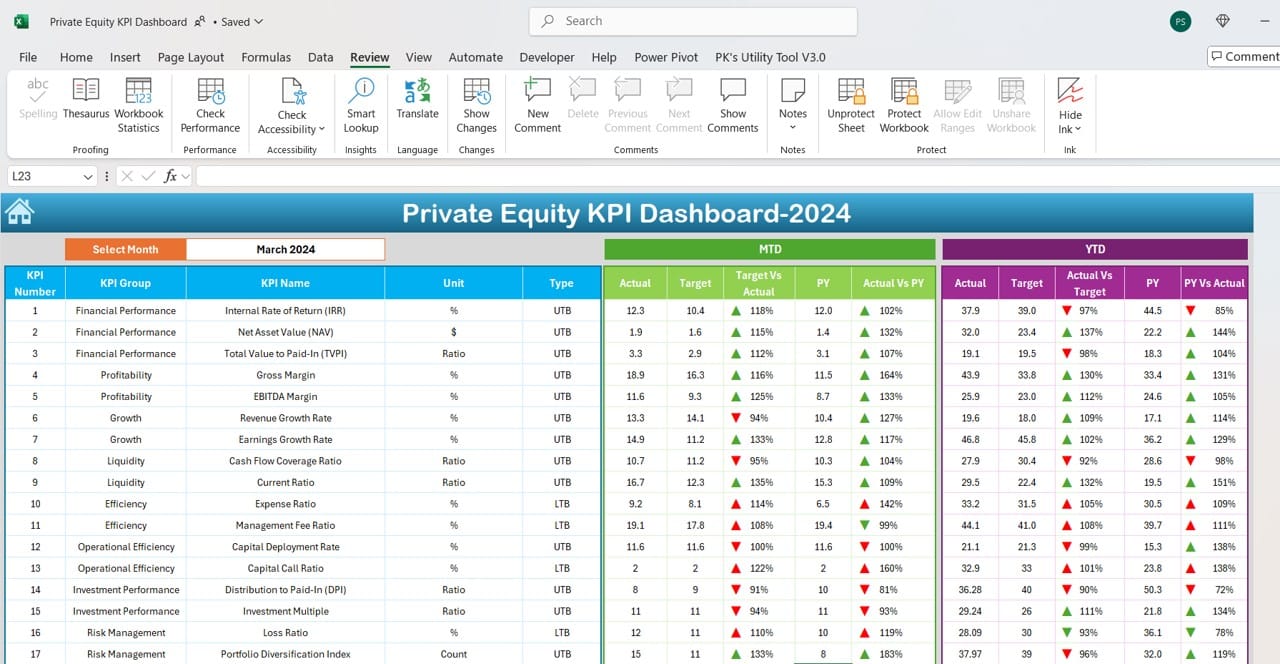
A central view of all KPIs, with month selection for tailored MTD, YTD, and previous year comparisons. Includes conditional formatting for up/down arrows indicating performance trends.
KPI Trend Sheet:
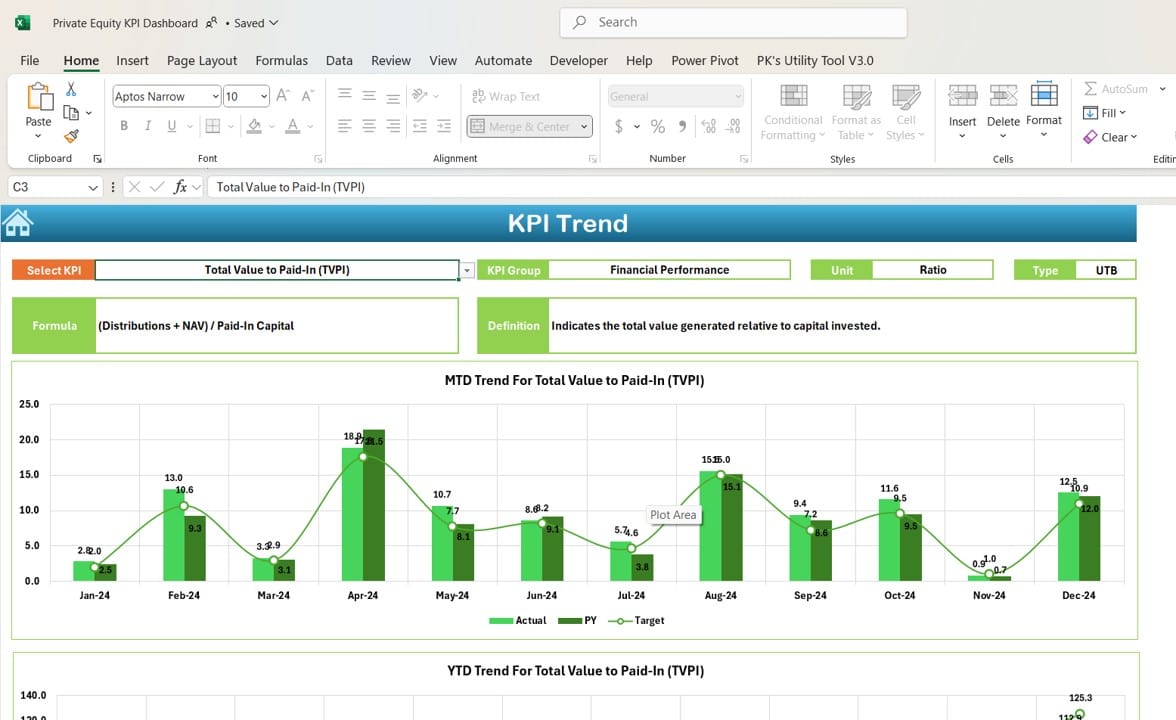
Select KPIs to view trends with MTD and YTD charts, along with details on KPI type, unit, and formula.
Actual Numbers Input:
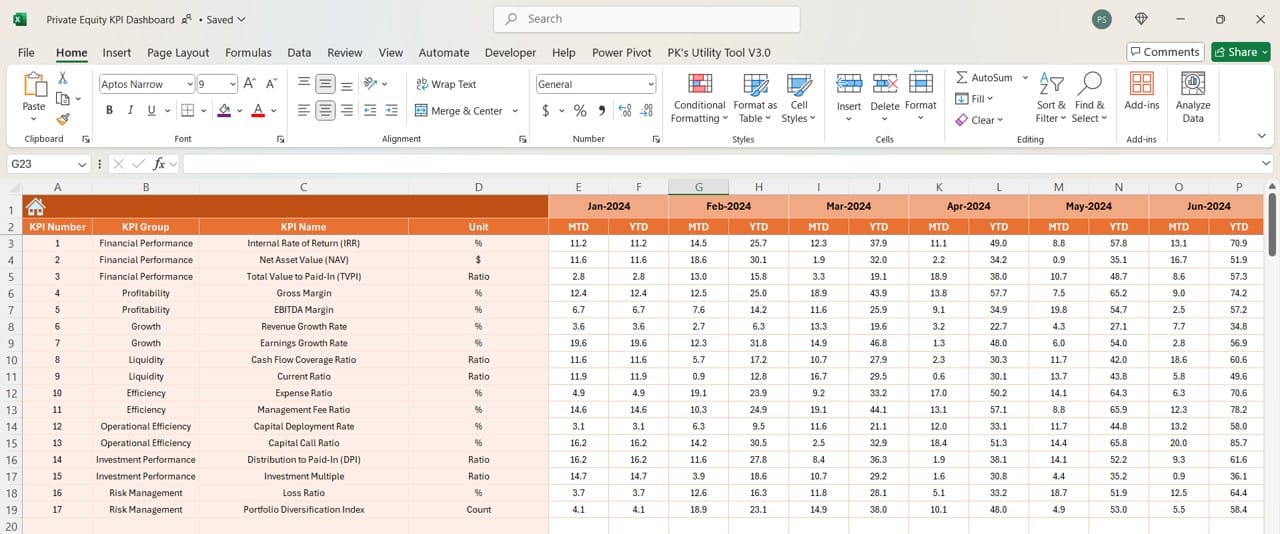
Input MTD and YTD data for any selected month, updating all dashboard figures dynamically.
Target Sheet:
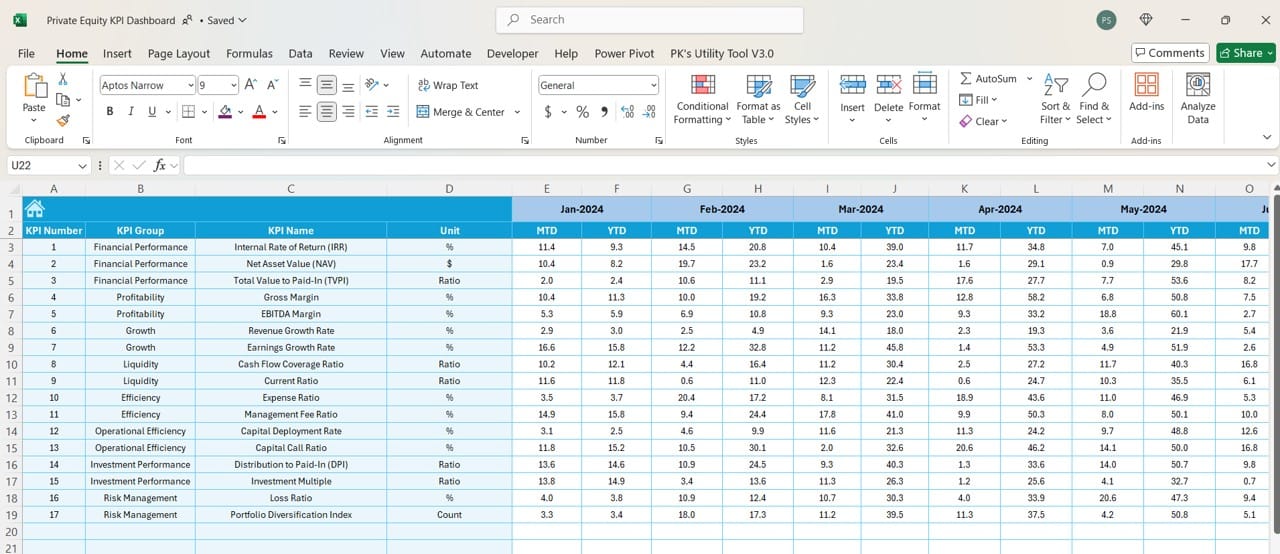
Enter target values for each KPI, including both MTD and YTD, for direct performance comparisons.
Previous Year Data:
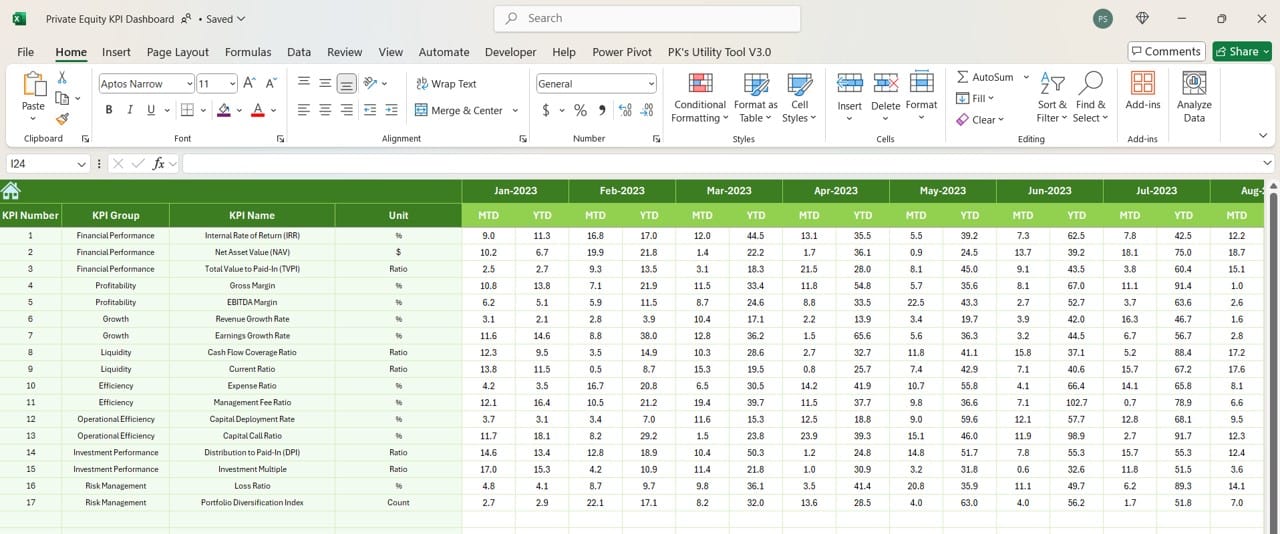
Log previous year numbers to enable year-over-year analysis.
KPI Definition Sheet:
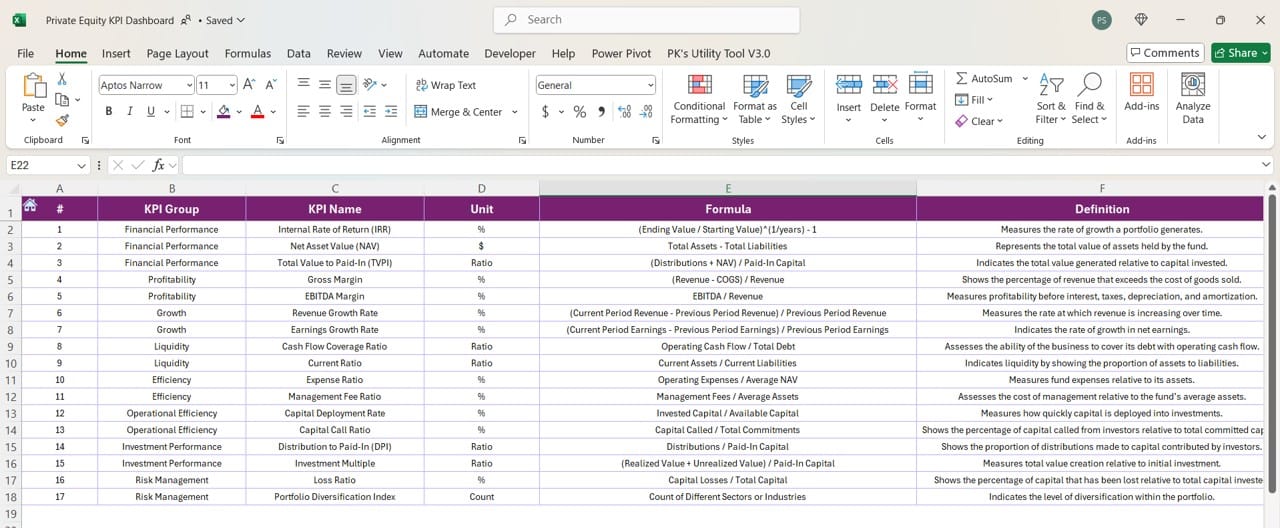
Comprehensive KPI information, including name, group, unit, and detailed definitions, for a clear understanding of each metric.
Read the detailed blog post