The Product Reviews and Ratings KPI Dashboard in Excel is a powerful and ready-to-use template designed to help businesses track, analyze, and improve product performance based on customer feedback. With automated calculations, interactive visualizations, and trend analysis, this dashboard enables data-driven decision-making, making it an essential tool for e-commerce businesses and product managers.
Key Features:
Home Sheet:
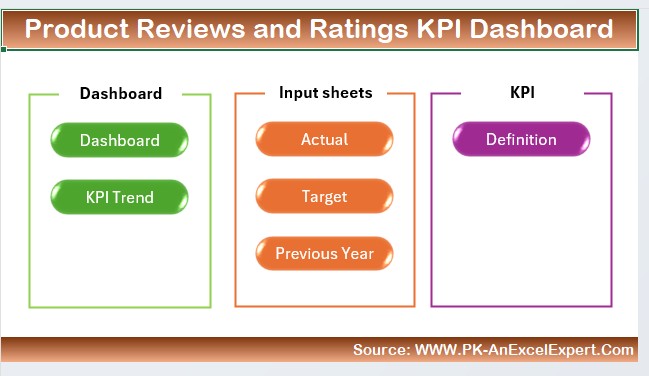
Provides an intuitive navigation panel with six quick-access buttons to different sheets.
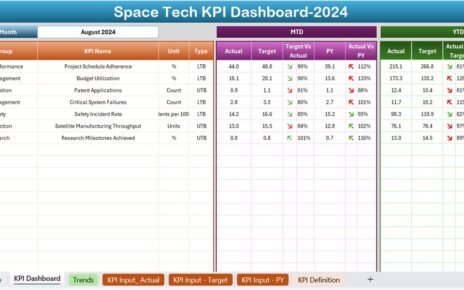
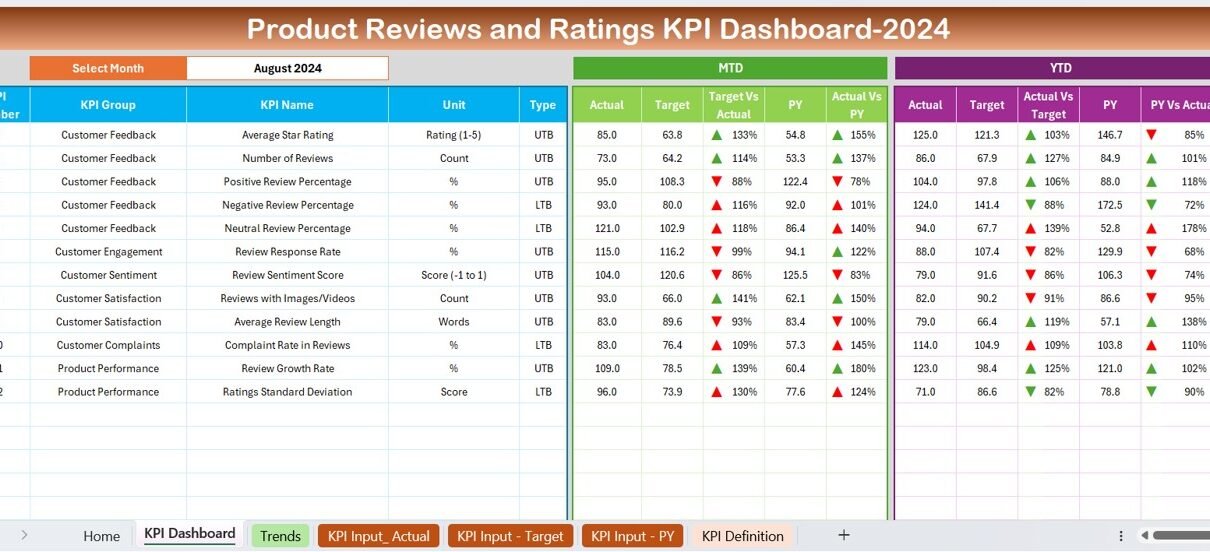
Dashboard Sheet Tab:
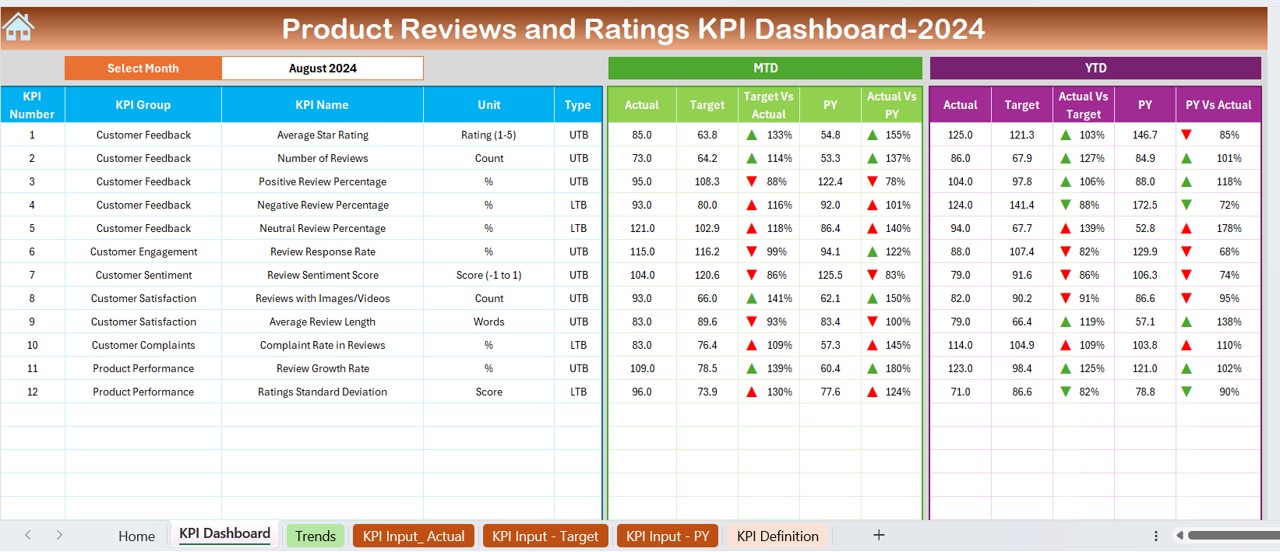
A dynamic, interactive dashboard displaying MTD and YTD performance metrics with conditional formatting for trends.
KPI Trend Sheet Tab:
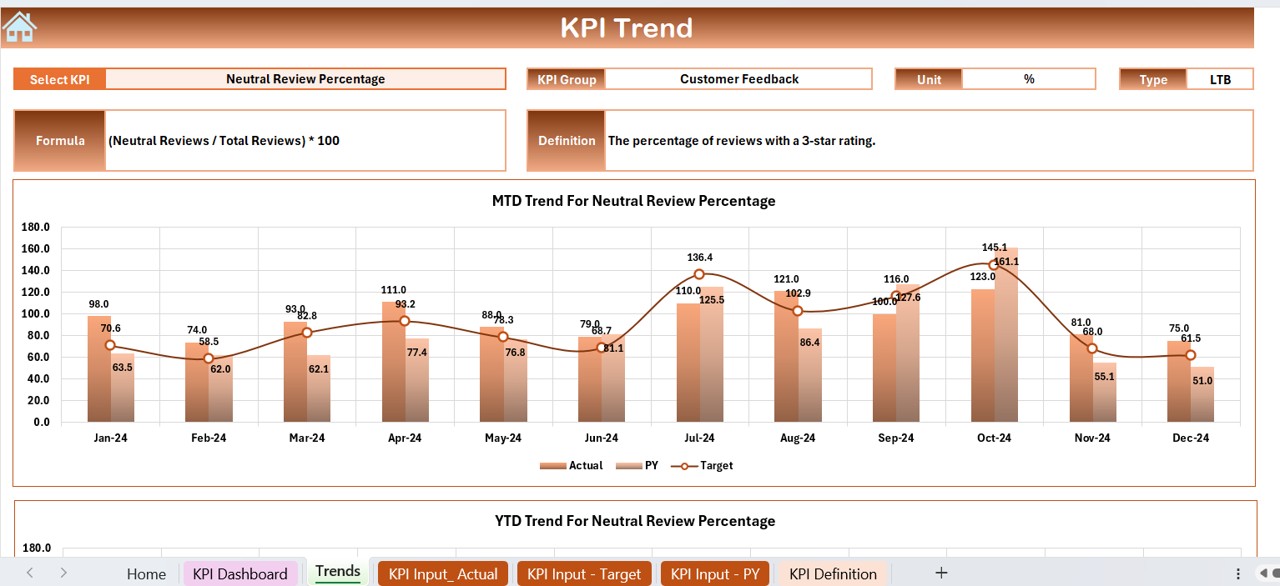
Allows users to select KPIs and view their definitions, formulas, unit types, and trend charts.
Actual Numbers Input Sheet:

Enter actual performance data for MTD and YTD, with an easy-to-update monthly selection.
Target Sheet Tab:
Input and compare monthly target values against actual performance for effective goal tracking.
Previous Year Number Sheet Tab:
Facilitates historical comparison by allowing users to enter and track previous year’s data.
KPI Definition Sheet Tab:
Stores detailed KPI descriptions, including grouping, units, and formula logic for consistency.