Home>Download>Profit Analysis Dashboard using What-if Parameter
Profit Analysis using What if Analysis

Profit Analysis Dashboard using What-if Parameter

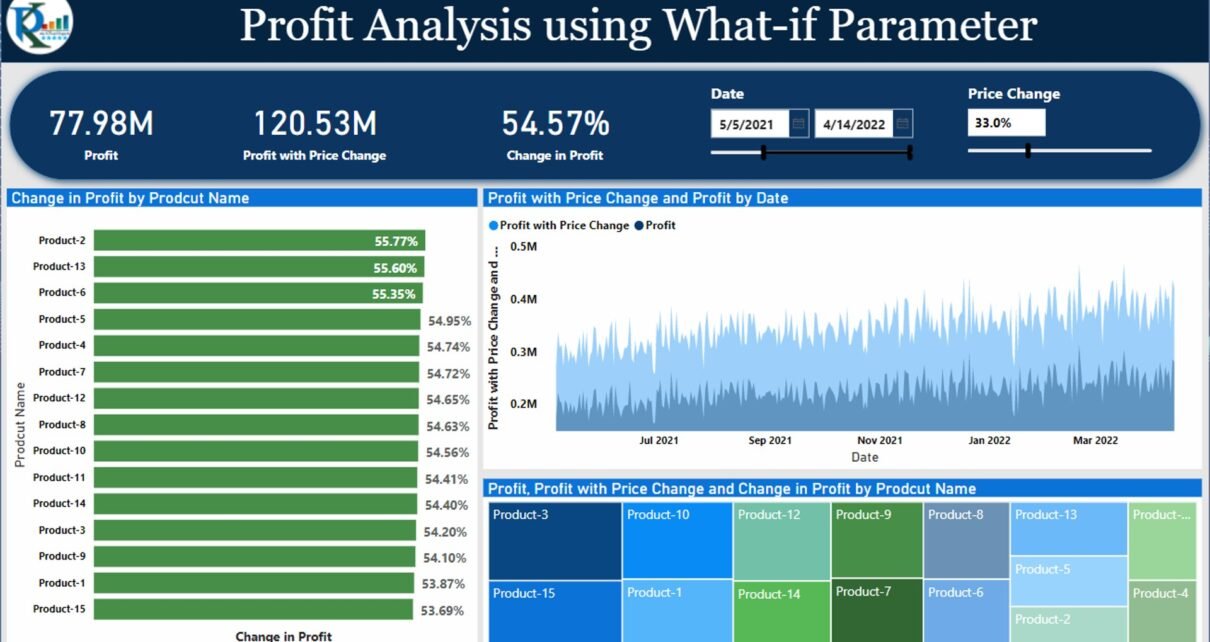
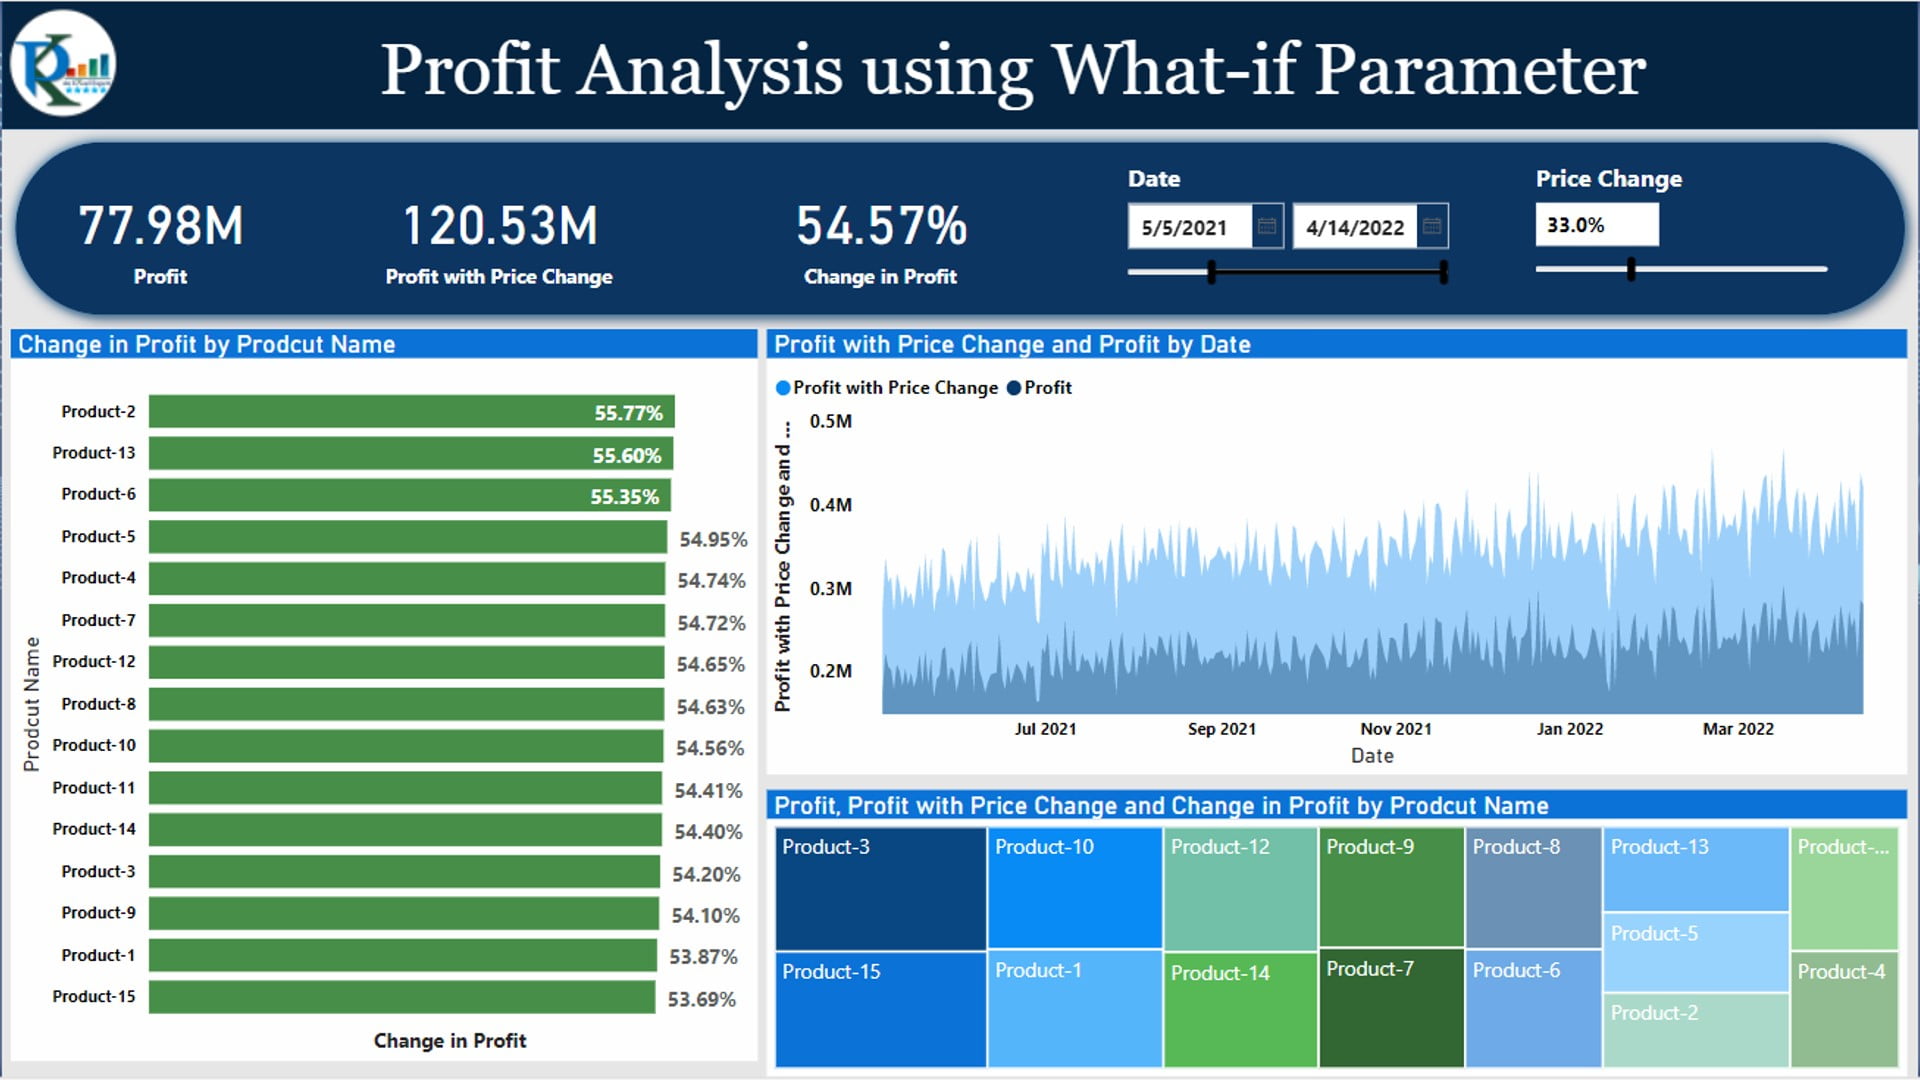
In this article, we have created a Profit Analysis Dashboard using the What-if Parameter in Microsoft Power BI. This powerful feature allows you to simulate different scenarios and analyze their impact on your profits, making it an invaluable tool for sales and financial analysis.


Profit Analysis Dashboard using What-if Parameter

Key Features of Profit Analysis Dashboard using What-if Parameter

  • Scenario Simulation: Utilize the What-if Parameter to create different scenarios and assess their potential impact on your profits, enabling more informed decision-making.
  • Interactive Dashboards: Enhance your sales dashboards with interactive elements that allow users to explore various outcomes and gain deeper insights into profit trends.
  • Comprehensive Analysis: The dashboard provides a detailed and dynamic view of your profit data, making it easier to identify patterns, trends, and opportunities for improvement.
PK
Meet PK, the founder of PK-AnExcelExpert.com! With over 15 years of experience in Data Visualization, Excel Automation, and dashboard creation. PK is a Microsoft Certified Professional who has a passion for all things in Excel. PK loves to explore new and innovative ways to use Excel and is always eager to share his knowledge with others. With an eye for detail and a commitment to excellence, PK has become a go-to expert in the world of Excel. Whether you're looking to create stunning visualizations or streamline your workflow with automation, PK has the skills and expertise to help you succeed. Join the many satisfied clients who have benefited from PK's services and see how he can take your Excel skills to the next level!
https://www.pk-anexcelexpert.com