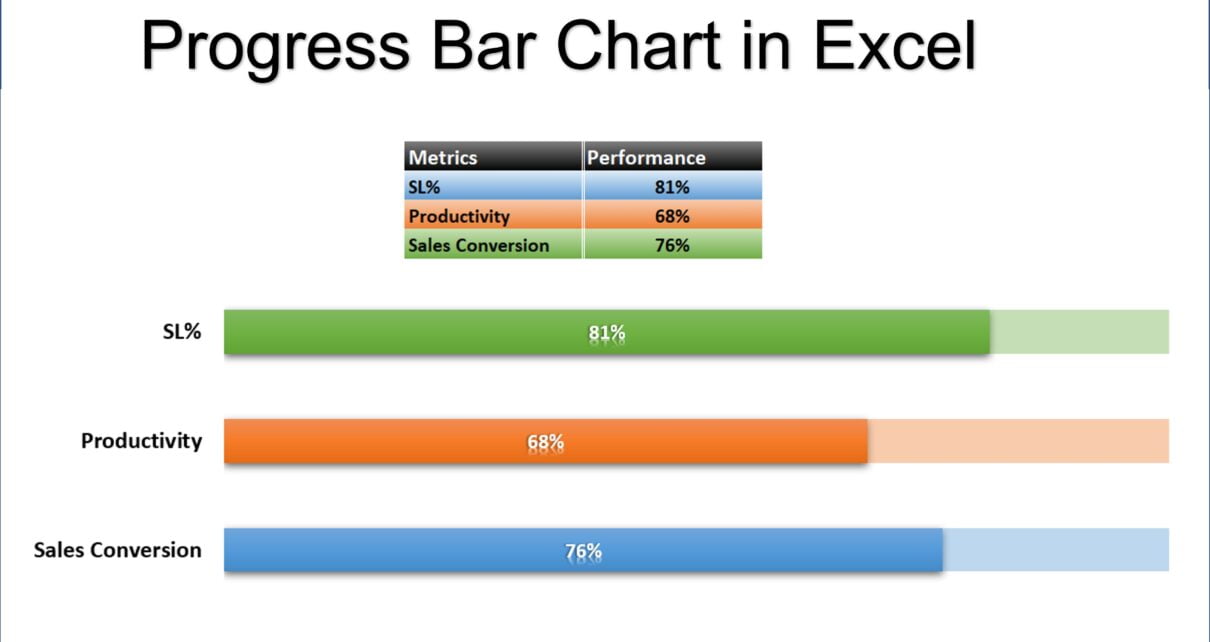
Our ready-to-use “Progress Bar Chart in Excel” template is an essential tool for visually tracking and displaying completion percentages or other key metrics. This versatile template is designed to effortlessly present Service Level Values, Productivity, and Sales Conversion rates, making it perfect for monitoring performance and progress.
Progress Bar Chart in Excel
18
Jun 2024
37Comments Off on Progress Bar Chart in Excel
PK
Meet PK, the founder of PK-AnExcelExpert.com! With over 15 years of experience in Data Visualization, Excel Automation, and dashboard creation. PK is a Microsoft Certified Professional who has a passion for all things in Excel. PK loves to explore new and innovative ways to use Excel and is always eager to share his knowledge with others. With an eye for detail and a commitment to excellence, PK has become a go-to expert in the world of Excel. Whether you're looking to create stunning visualizations or streamline your workflow with automation, PK has the skills and expertise to help you succeed. Join the many satisfied clients who have benefited from PK's services and see how he can take your Excel skills to the next level!
https://www.pk-anexcelexpert.com
Related Articles
Profit Analysis Dashboard using What-if Parameter
In this article, we have created a Profit Analysis using What-if Parameter in Microsoft Power BI. You can use this
Conditional Formatting in a Pivot Table with Example
Conditional formatting is a very useful feature in Microsoft Excel. If you are working on an Excel Report or Excel
Custom Visual: Liquid Fill Gauge in Power BI
Liquid Fill Gauge is very beautiful Custom visual for Power BI. You can use this chart to display metrics like