The Project Management KPI Dashboard in Excel is a comprehensive tool designed to help project managers track and visualize critical KPIs with ease. This ready-to-use template simplifies performance tracking, ensuring timely decision-making and project success Project Management KPI Dashboard in Excel.
Key Features:
Home Sheet:
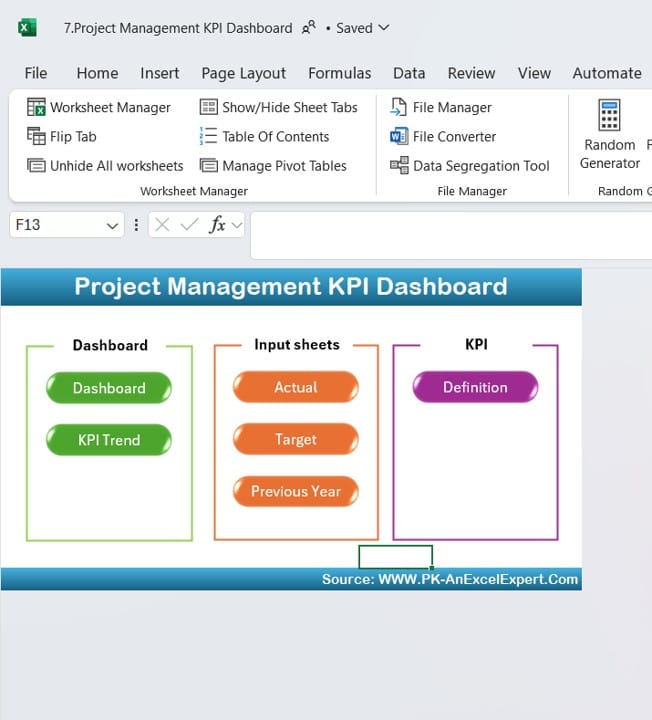
- Central navigation with six buttons for easy access to all sheets.
Dashboard Sheet:
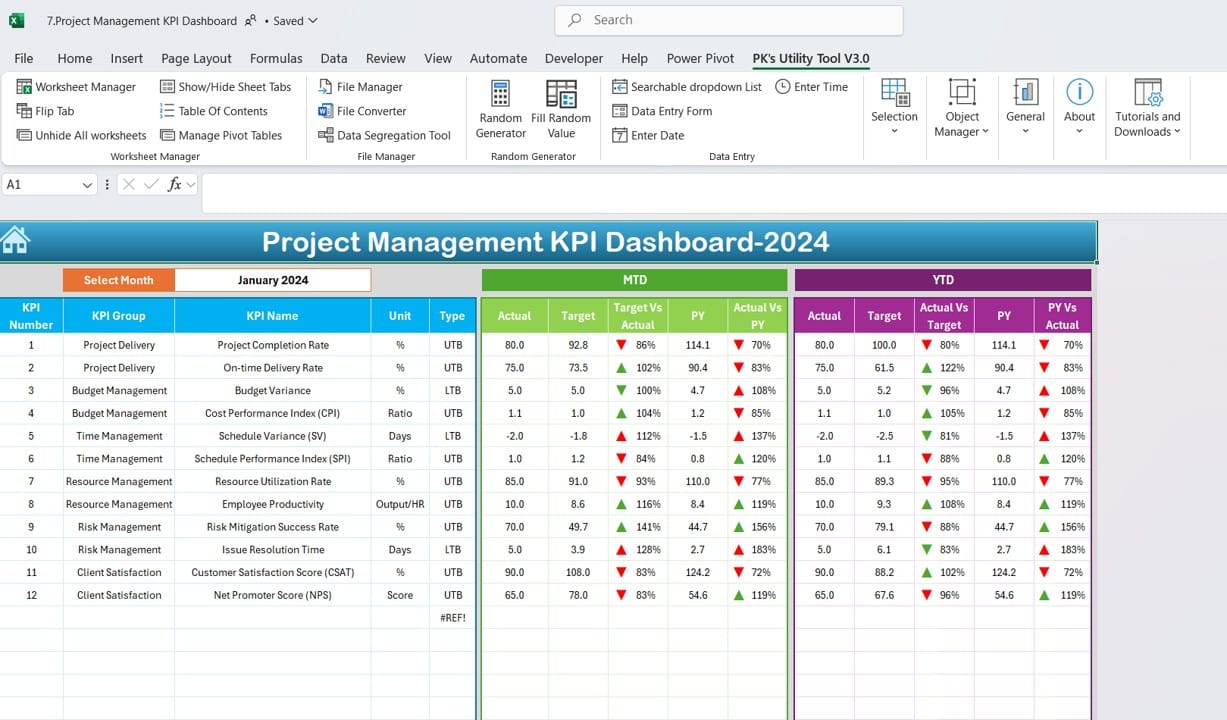
Dashboard SheetDisplays MTD and YTD actuals, targets, and previous year data with dynamic updates based on month selection.
KPI Trend Sheet:
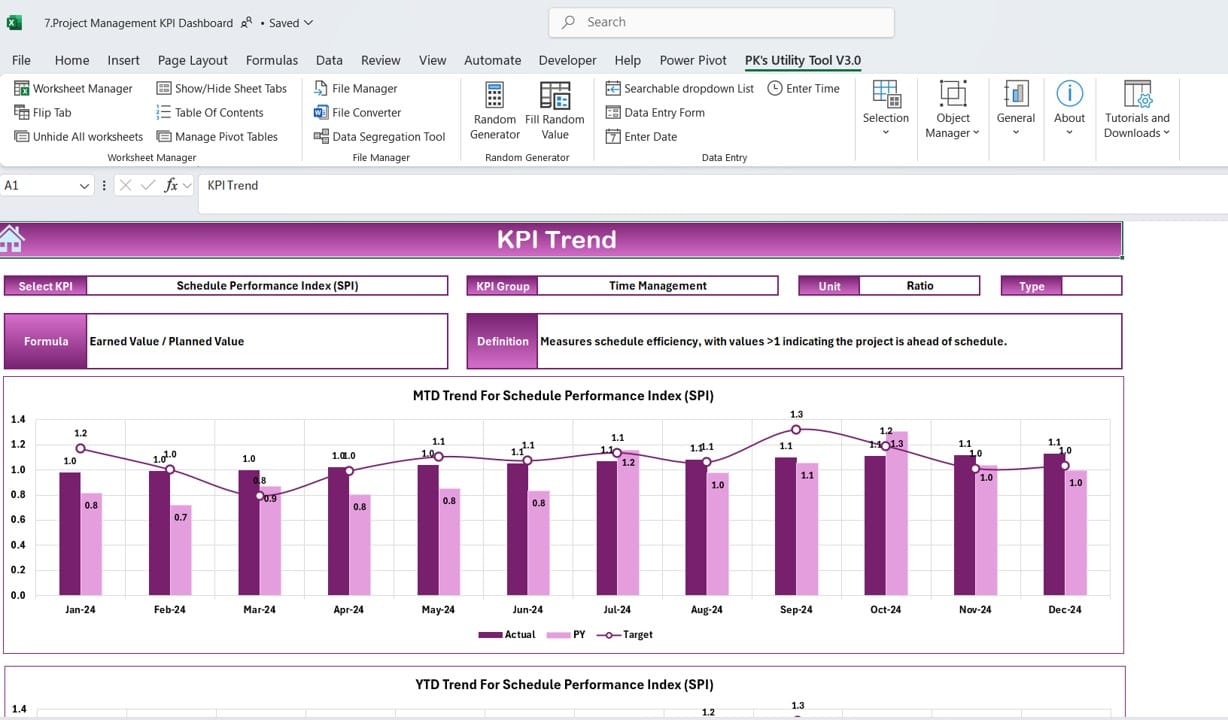
KPI Trend SheetVisualizes KPI trends with selectable KPI details, including formula and type (Lower/Upper is better).
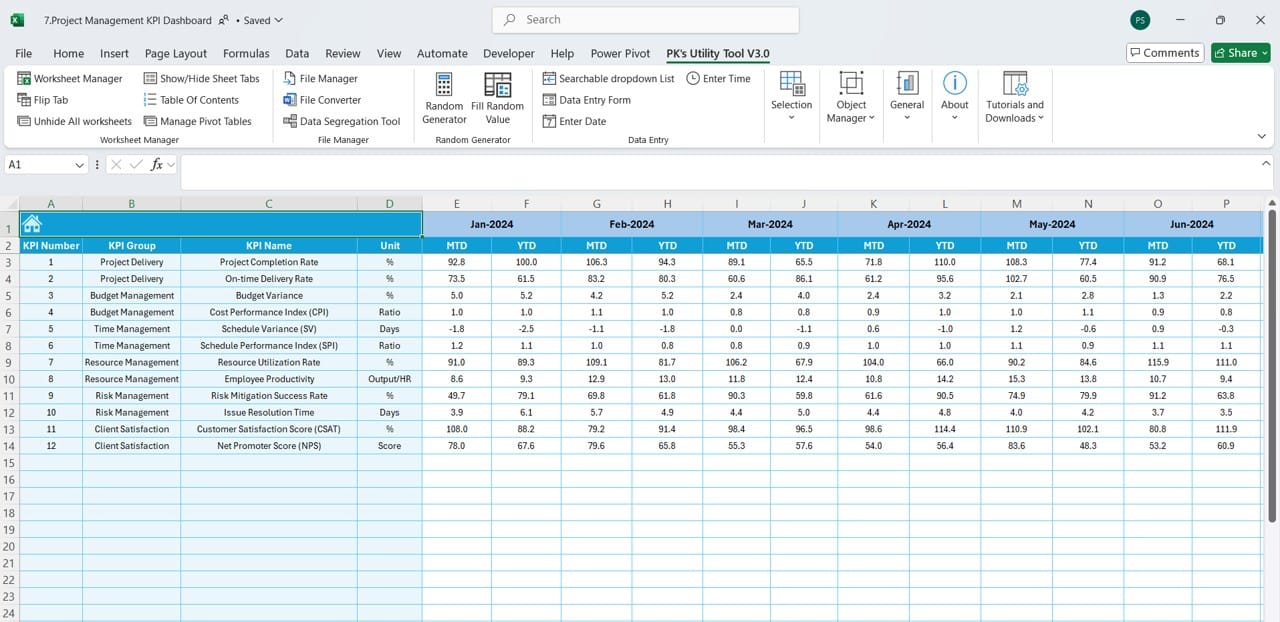
Actual Numbers Input:
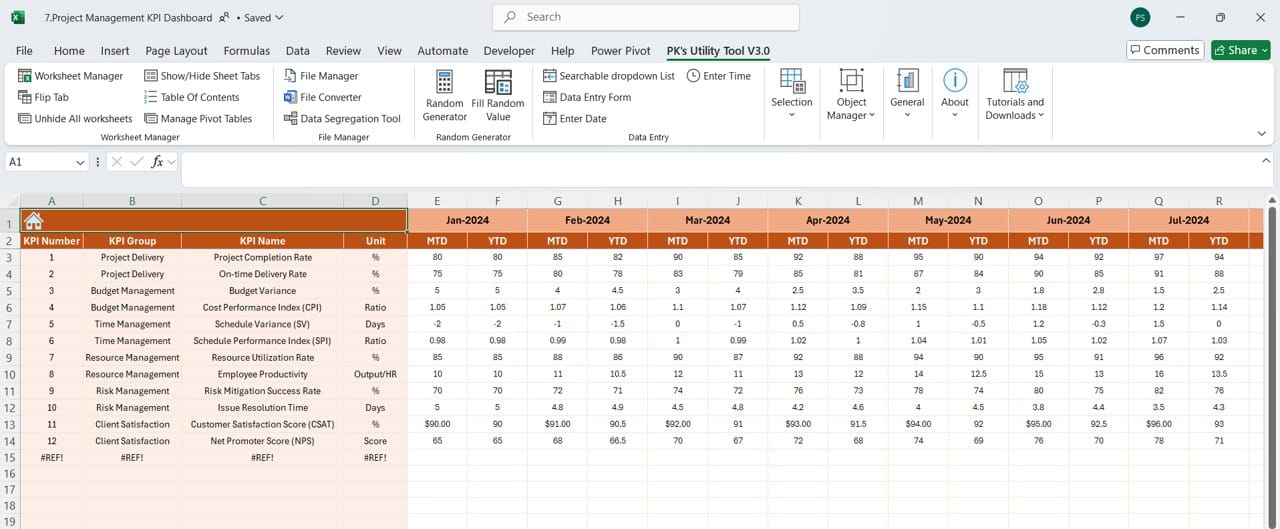
Easy-to-update input sheet for entering MTD and YTD actuals.
Target Sheet:
Input target values for monthly and yearly KPIs.
Previous Year Data:

Track historical performance with previous year KPI numbers.
KPI Definition Sheet:
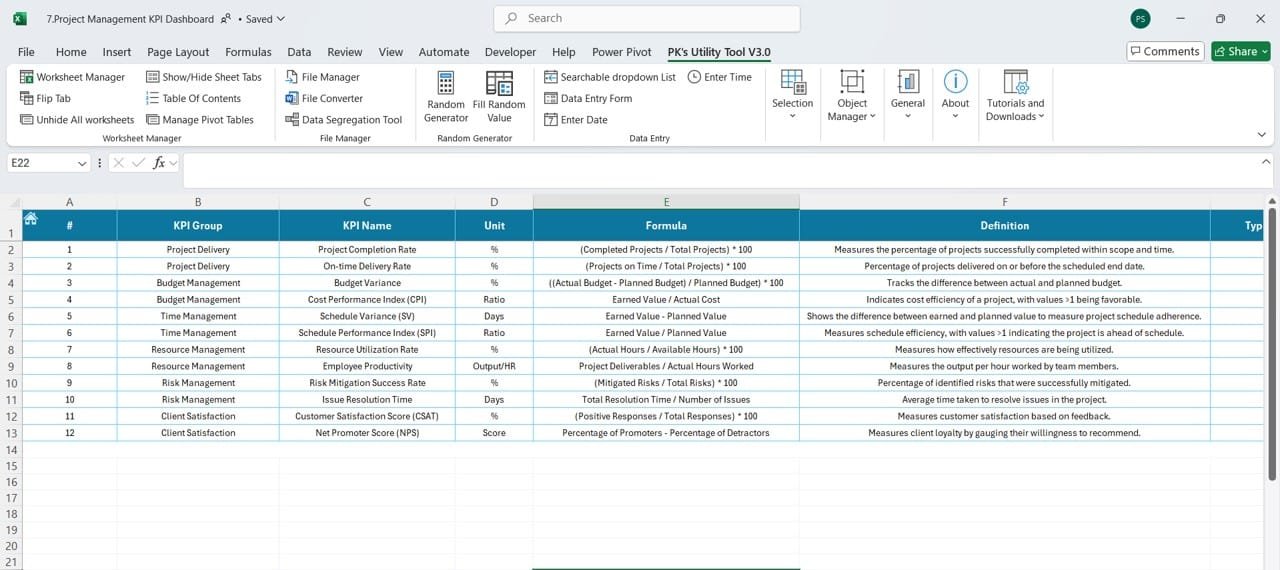
KPI Definition Sheet Clearly defines each KPI, including its unit, formula, and group.
Read the detailed blog post