Efficiently tracking public health performance metrics is crucial for making data-driven decisions. Our Public Health KPI Dashboard in Power BI provides an interactive, ready-to-use solution that captures healthcare performance indicators, enabling real-time monitoring and analysis. This dashboard seamlessly integrates with Excel data sources, ensuring accurate and up-to-date insights for improved public health management.
Key Features of the Public Health KPI Dashboard
Three Interactive Pages:
Summary Page
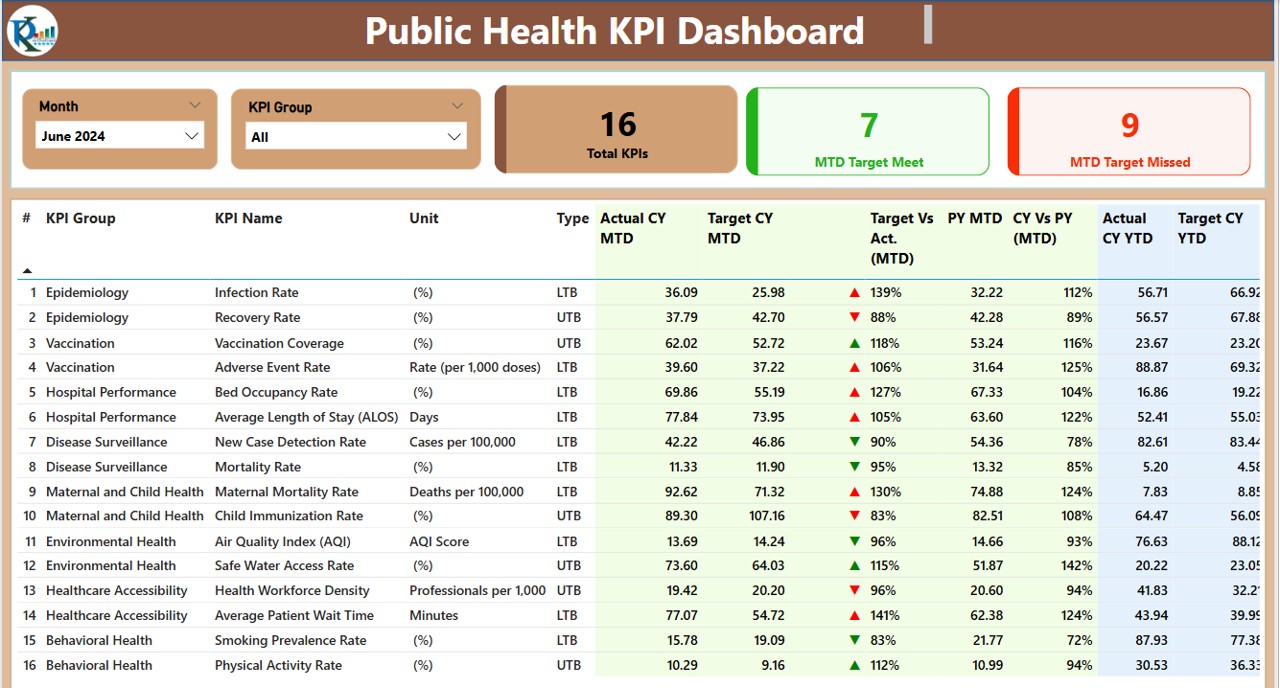
- Displays KPIs overview, with slicers for filtering by month and KPI group, along with real-time performance indicators.
KPI Trend Page
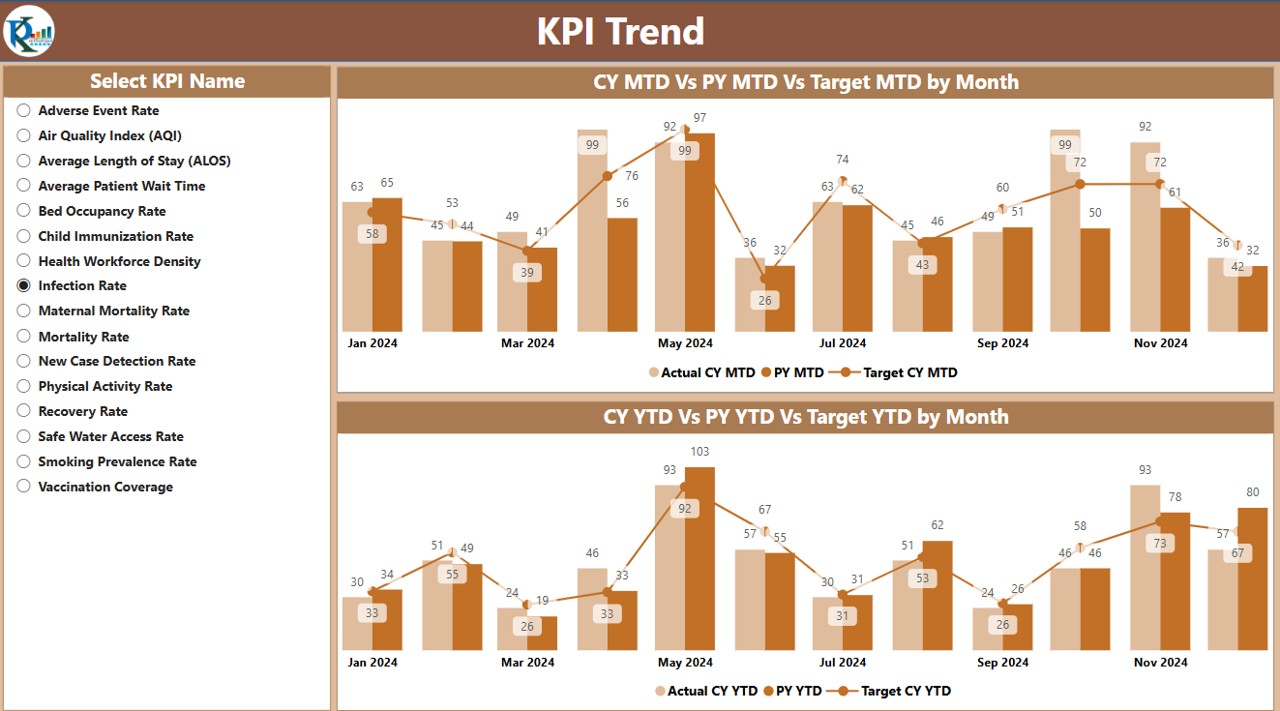
- Showcases MTD and YTD trend analysis through combo charts for Current Year, Previous Year, and Target values.
KPI Definition Page
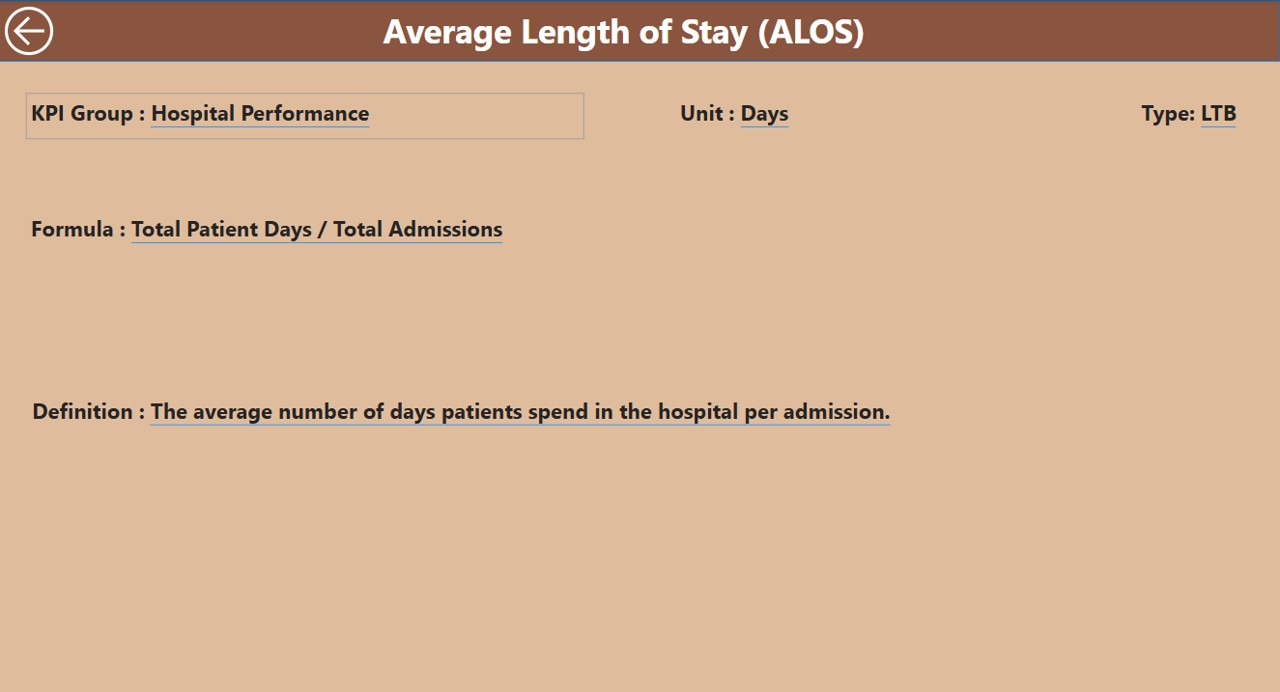
- Provides detailed KPI descriptions, including formulas, definitions, and performance classification (LTB/UTB).
Data-Driven Insights:
- Real-time tracking of MTD and YTD actual vs. target performance.
- Visual status indicators (✅▲ for positive and ❌▼ for negative) to highlight KPI achievement gaps.
Seamless Data Integration:
- Excel-based data entry for actual values, targets, and KPI definitions, ensuring ease of use.
- Automated calculations for performance comparisons across different time periods.