The Public Relations KPI Dashboard in Power BI is a powerful tool designed to help PR teams track and measure the effectiveness of their campaigns in real-time. With the increasing need for data-driven decision-making, this dashboard offers valuable insights into various aspects of PR performance, including media mentions, audience engagement, sentiment analysis, and more.
By using Power BI, PR professionals can seamlessly integrate data from multiple sources, visualize it in interactive charts, and make quick decisions to enhance their PR strategies. This dashboard enables teams to monitor both short-term and long-term PR outcomes, ensuring alignment with organizational goals.
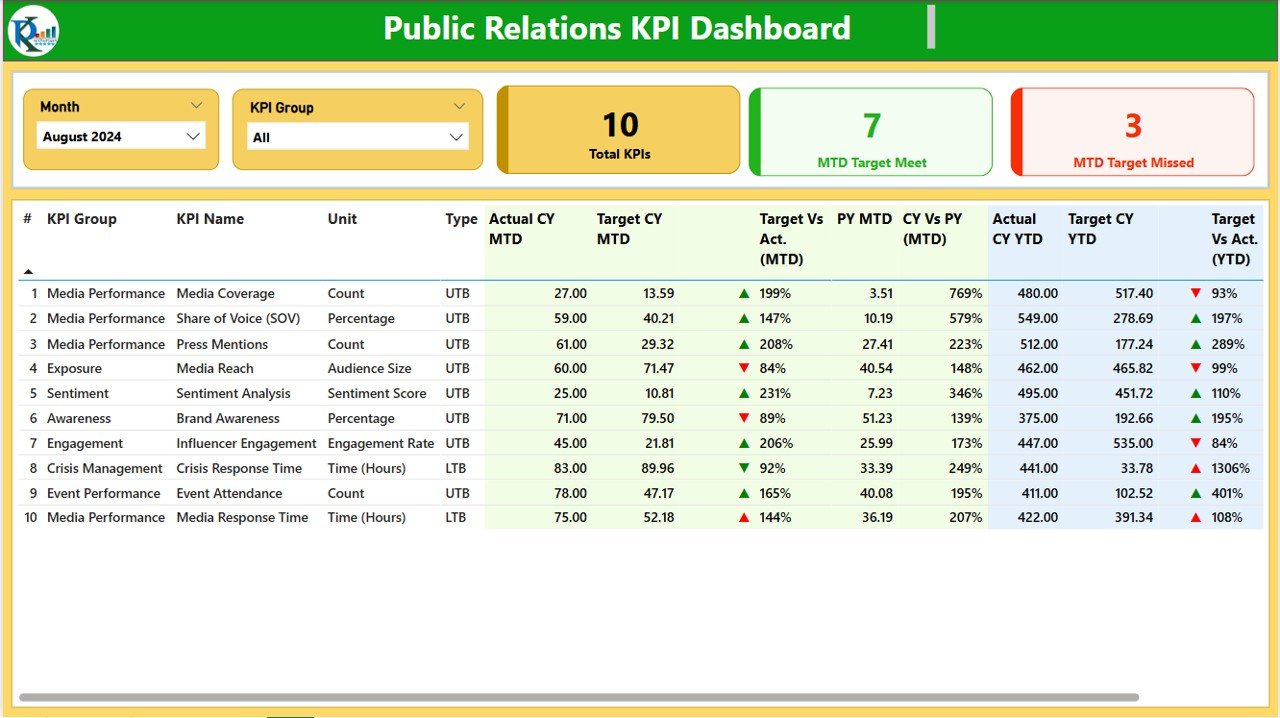
Key Features of the Public Relations KPI Dashboard in Power BI
Summary Page
- Overview of all PR-related KPIs
- KPI cards showing Total KPIs Count, MTD Target Meet Count, and MTD Target Missed Count
- A detailed table showing data like KPI names, units, actual vs. target comparisons, and Year-over-Year analysis
KPI Trend Page
- Combo charts for tracking MTD (Month-to-Date) and YTD (Year-to-Date) performance
- A slicer to focus on specific KPIs

KPI Definition Page
- Drill-through page with KPI formulas, definitions, and types
- Back button for easy navigation to the Summary Page

This dashboard is designed to provide comprehensive data visualization, making it easier for PR teams to track, assess, and improve the effectiveness of their campaigns.