In today’s competitive and fast-paced publishing industry, companies must efficiently track and measure their performance to remain ahead of the curve. The Publishing KPI Dashboard in Power BI is an intuitive, customizable tool designed to help businesses in the publishing sector monitor their key performance indicators (KPIs) in real-time. Whether it’s print runs, subscription numbers, advertising revenue, or content engagement, this dashboard allows publishers to analyze important metrics, gain insights, and make informed decisions to improve business outcomes.
Key Features of the Publishing KPI Dashboard in Power BI
The Publishing KPI Dashboard in Power BI is structured with three essential pages, each providing a unique view of the data to facilitate better decision-making and operational management. Below are the key features of the dashboard:
Summary Page
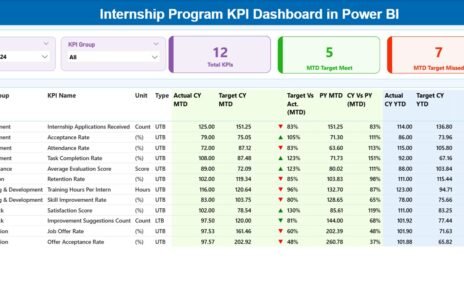
The Summary Page is the main page of the dashboard, offering a high-level view of all key performance metrics. It includes customization options to filter by month or KPI group.
KPIs Overview Cards: These cards display three important metrics:
- Total KPIs Count
- MTD (Month-to-Date) Target Met Count
- MTD Target Missed Count
Detailed KPI Table: This table presents in-depth data on each KPI:
- KPI Number: A unique identifier for each KPI.
- KPI Group: The category or classification of each KPI.
- KPI Name: The specific name of the KPI.
- Unit: The unit of measurement (e.g., number of subscriptions, dollars).
- Type: The type of KPI (LTB – Lower the Better or UTB – Upper the Better).
- Actual CY MTD: The actual value for the current year’s MTD.
- Target CY MTD: The target value for the current year’s MTD.
- MTD Icon: A visual icon (▼ or ▲) indicating whether the KPI has met its target.
- Target Vs Actual (MTD): A percentage comparing the actual versus the target MTD value.
- PY MTD (Previous Year MTD): The MTD value for the same period in the previous year.
- CY vs PY (MTD): A percentage comparing the current year’s MTD to the previous year’s MTD.
- Actual CY YTD (Year-to-Date): The actual YTD value for the current year.
- Target CY YTD: The target YTD value for the current year.
- YTD Icon: A visual icon indicating whether the KPI has met its YTD target.
- Target Vs Actual (YTD): A percentage comparing the actual versus the target YTD value.
- PY YTD (Previous Year YTD): The YTD value for the same period in the previous year.
- CY vs PY (YTD): A percentage comparing the current year’s YTD to the previous year’s YTD.

KPI Trend Page
The KPI Trend Page provides users with a visual representation of how KPIs perform over time. This page includes:
- Combo Charts: These charts allow for a comparison between the actual values of the current year, the previous year, and targets for both MTD and YTD, providing clear insights into trends.
- Slicers: A slicer is provided to allow users to select specific KPIs, making it easier to focus on particular areas of publishing performance.

KPI Definition Page
The KPI Definition Page is a drill-through page providing in-depth details on each KPI, including:
- KPI Formula: The formula used to calculate the KPI.
- KPI Definition: A detailed explanation of what each KPI measures and its relevance to overall publishing goals.