Managing and tracking R&D activities can be challenging without the right tools. The R&D Activity Calendar in Excel is designed to streamline scheduling, track events, and ensure efficient management of R&D tasks. This customizable, user-friendly template helps keep your team organized and on track with every research and development project.
Key Features of the R&D Activity Calendar in Excel
The R&D Activity Calendar in Excel comes equipped with five essential worksheets, each providing a unique and valuable feature to streamline R&D management. Below is a breakdown of these features:
1. Home Sheet Tab
The Home Sheet Tab acts as the central hub of the calendar. It contains four essential buttons that allow easy navigation to various sections of the calendar:
- Annual View button
- Monthly View button
- Daily View button
- Events button
This sheet helps you jump to any section quickly, ensuring that you can navigate the R&D calendar seamlessly.

2. Annual View Sheet Tab
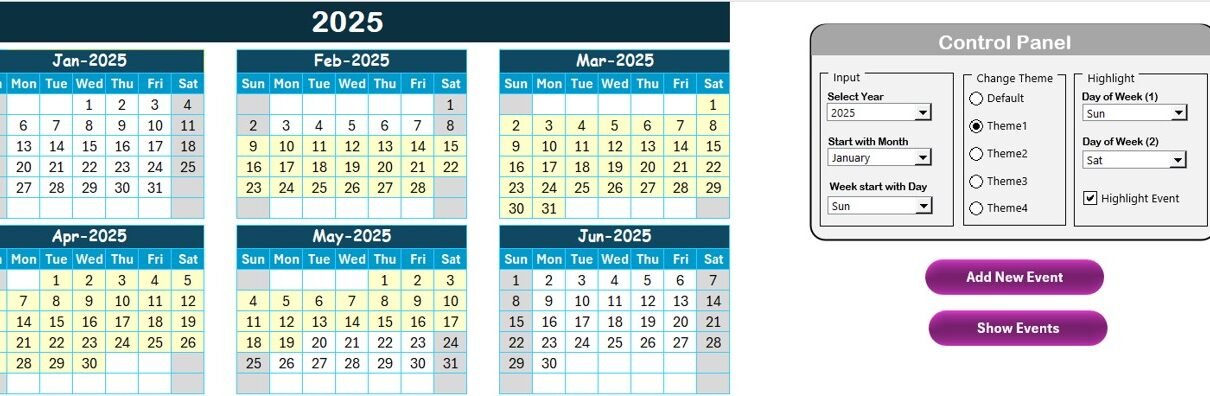
The Annual View Sheet Tab displays the full year’s worth of R&D activities, showing 12 months of the year in a comprehensive layout. This gives you an overview of all scheduled tasks and events across the year.

Key Features of the Annual View Sheet:
Control Panel: This panel includes three important groups:
- Input Group: Allows you to change the year, starting month, and the starting day of the week for the calendar.
- Change Theme Group: Choose from five different color themes to apply across the workbook.
- Highlight Group: Select specific days of the week (like Saturdays and Sundays) to highlight, and even highlight events in yellow.
Add New Event button: Easily add events to a selected date on the calendar by simply clicking on a date and filling out the event form.
Show Event button: This shows all events on the selected date, allowing you to track all the activities associated with that day.
3. Monthly View Sheet Tab
The Monthly View Sheet Tab displays the calendar of the selected month. It shows all events for that month, with the ability to select the month and year dynamically. If multiple events are scheduled for the same day, the calendar will display “more than 1…” to indicate the number of events on that date.

Key Features of the Monthly View Sheet:
- Add New Event button: Similar to the Annual View, you can select a date, click the button, and add events for that specific day.
- Show Event button: Displays a list of events scheduled for the selected date.
4. Daily View Sheet Tab
The Daily View Sheet Tab helps you track events by date range. By selecting a start date and an end date, this tab shows all events between the selected range. It’s perfect for a closer look at multiple R&D activities taking place within a specific time frame.

Key Features of the Daily View Sheet:
- Refresh Button: Once you’ve selected your date range, click on the refresh button to load the latest events for that period.
- Add New Event button: Similar to the other views, you can add events by selecting the date and filling out the form.
5. Events Sheet Tab
The Events Sheet Tab acts as the database for storing all event details. Here you can manage event data, update or delete records, and ensure that all details are accurate.