
The Real Estate KPI Dashboard in Excel is a comprehensive tool designed to help real estate professionals track and analyze key performance indicators with ease. This ready-to-use Excel template simplifies KPI management, offering insights into MTD and YTD performance, target achievements, and year-over-year comparisons—all in a user-friendly interface.
Key Features:
Home Sheet:
Easy navigation with buttons to jump between different sections of the dashboard.
Dynamic Dashboard:
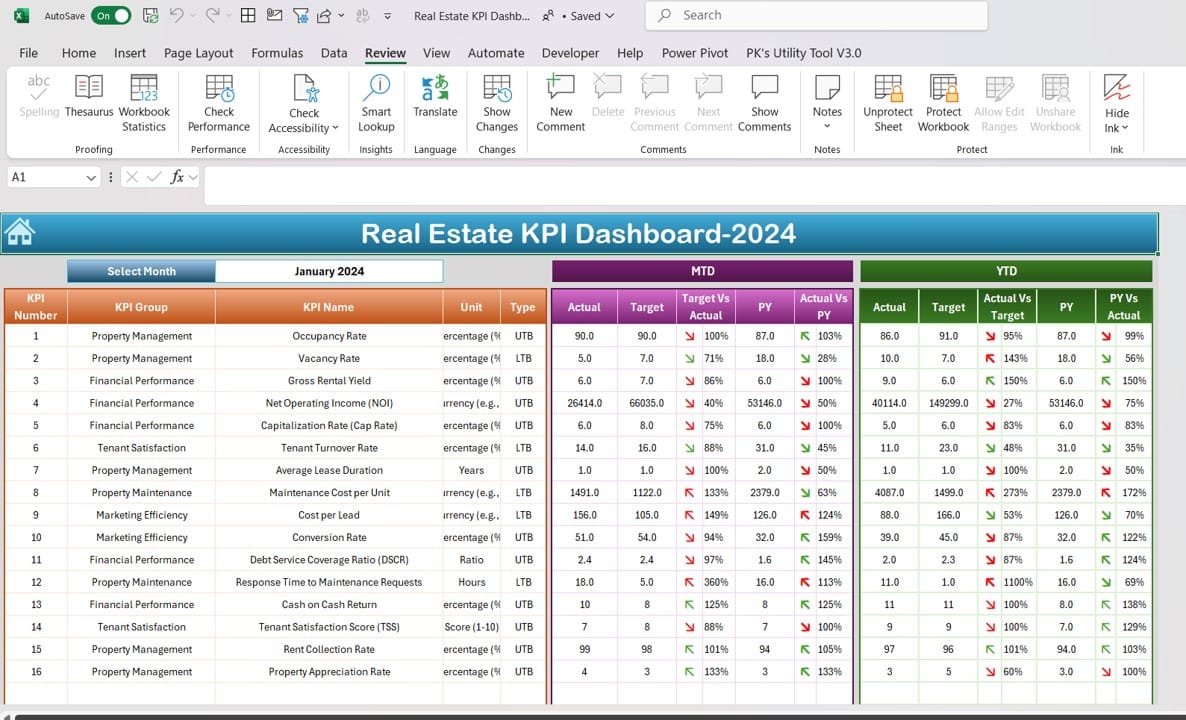
Automatically updates KPI data based on the selected month, with visual indicators like up/down arrows for quick trend analysis.
KPI Trend Charts:
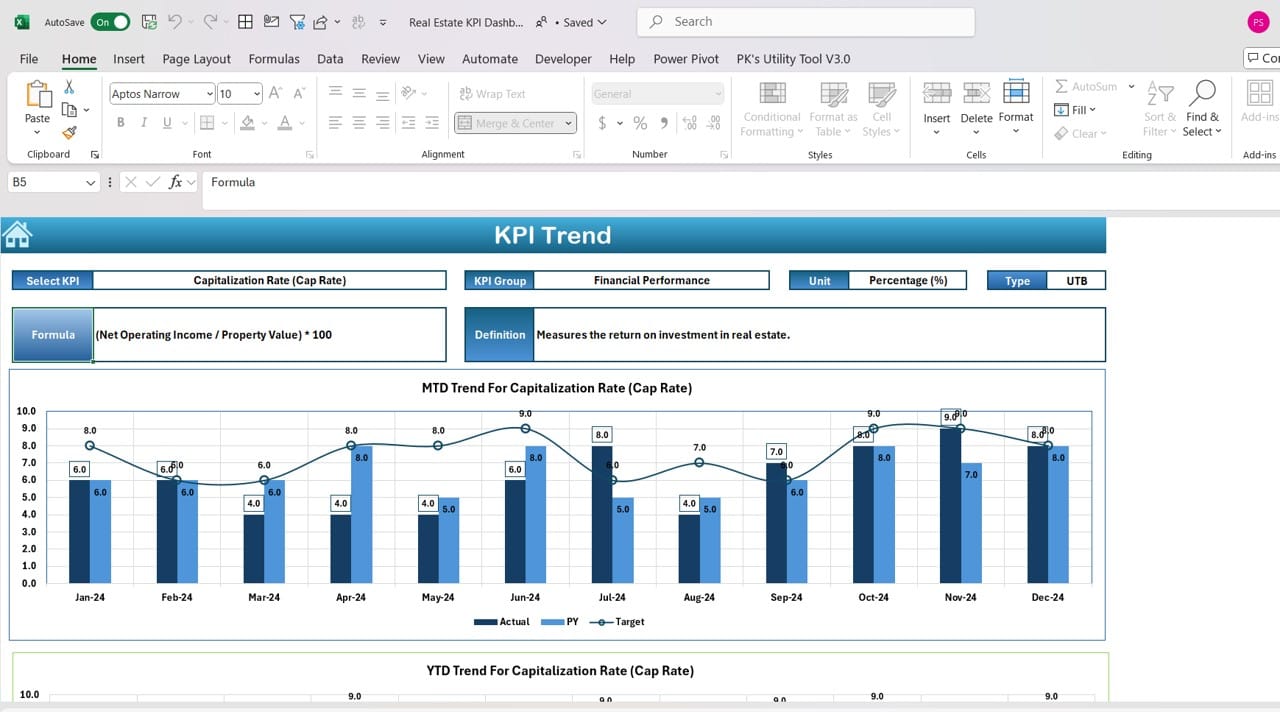
Visualize MTD and YTD trends for each KPI, including Actual, Target, and Previous Year comparisons.
Data Input Sheets:
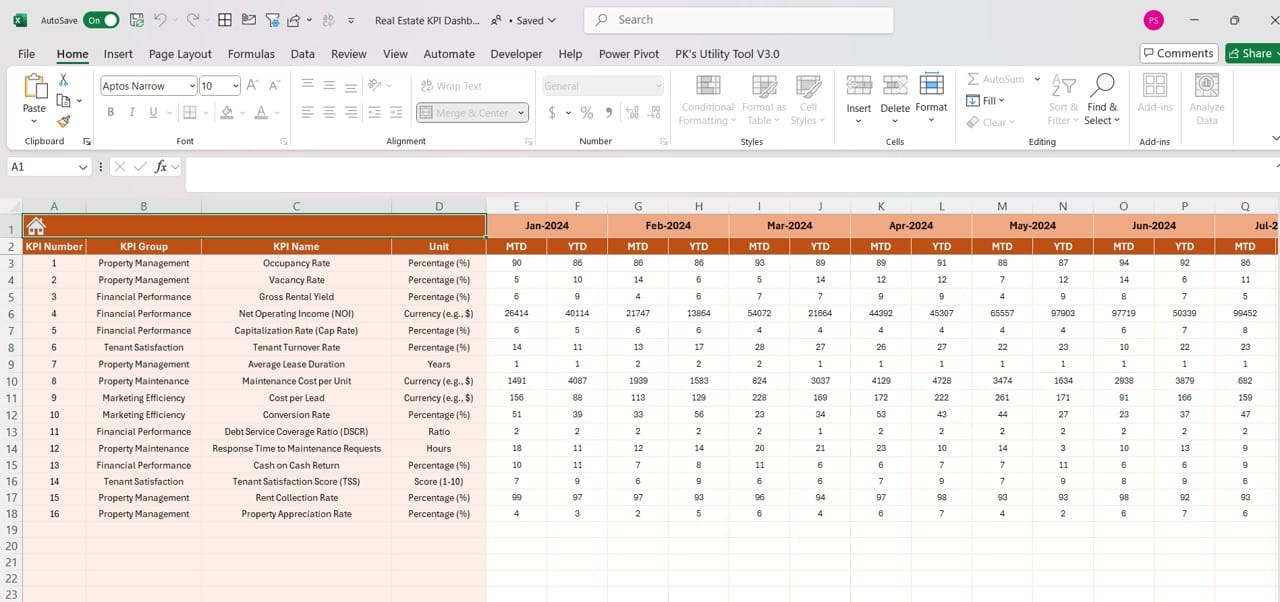
Input actual, target, and previous year’s data for seamless tracking of performance.
KPI Definition:
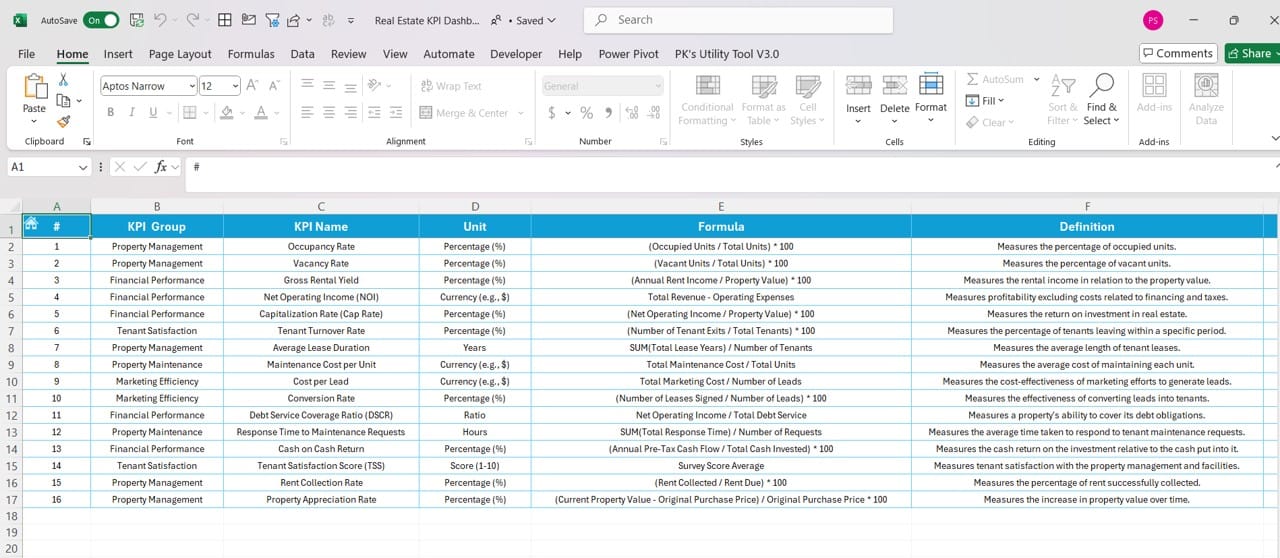
Clearly defined KPIs, including formulas, groups, units, and descriptions, ensuring complete clarity for the user.
Read the detailed blog post

