The Recruitment Funnel KPI Dashboard in Excel is an essential tool for organizations to monitor and enhance their recruitment process. By tracking key performance indicators (KPIs) throughout the recruitment funnel, businesses can make data-driven decisions, optimize hiring strategies, and improve overall recruitment efficiency. This customizable Excel template empowers recruitment teams with the ability to analyze each stage of the funnel, from sourcing to onboarding, ensuring a streamlined hiring process.
Key Features of the Recruitment Funnel KPI Dashboard in Excel
This Recruitment Funnel KPI Dashboard comes with several powerful features to enhance your recruitment tracking and decision-making:
Home Sheet:
Acts as an index sheet with six clickable buttons to navigate easily to the different sections of the dashboard.

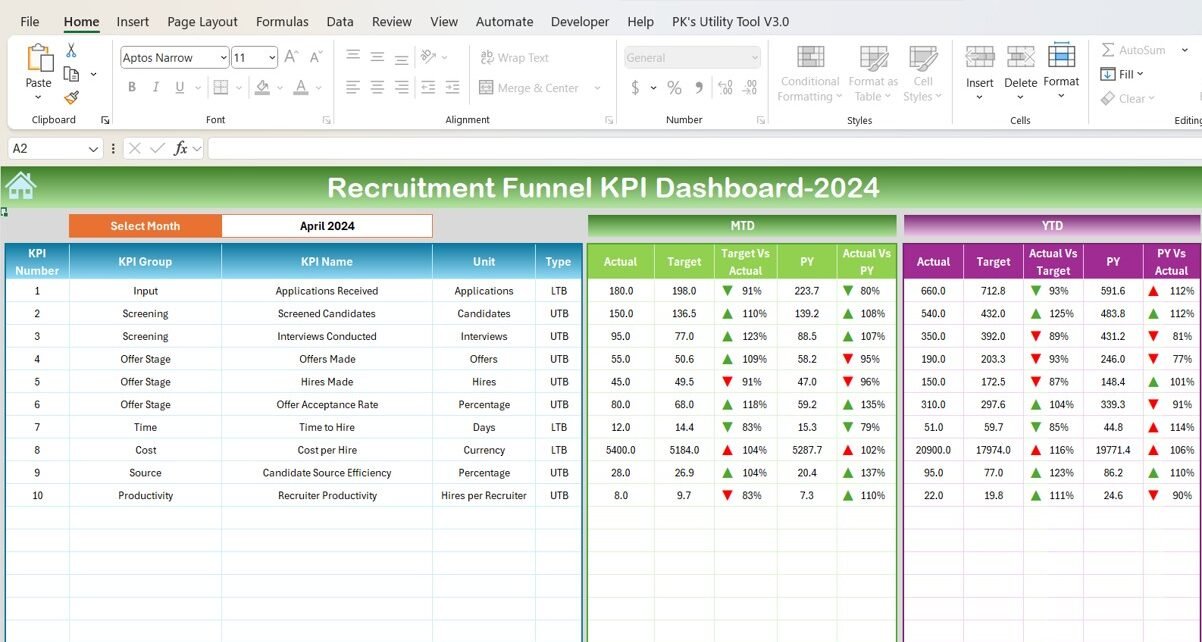
Dashboard Sheet Tab:
Displays all key KPIs in a consolidated view. You can select a specific month from a dropdown list (cell D3), and the dashboard updates automatically, showing MTD, YTD, and previous year data along with conditional formatting for comparisons (up and down arrows for target vs. actual performance).

KPI Trend Sheet Tab:
Allows you to select KPIs from a dropdown menu to see detailed information, including KPI group, unit, type, formula, and definitions for each KPI. This section offers deep insights into each metric’s importance in the recruitment process.

Actual Numbers Sheet Tab:
Input actual performance data for each KPI, including MTD and YTD numbers for the selected month. This section helps track real-time performance, making it easy to monitor and react to any trends or issues.
Target Sheet Tab:
Enter target values for each KPI for both MTD and YTD. These benchmarks provide clear goals to compare the actual performance against, helping you assess whether you’re on track to meet your recruitment objectives.
Previous Year Numbers Sheet Tab:
Records previous year’s data for comparison. This feature helps track year-over-year performance, providing valuable insights into how your recruitment strategies have evolved.
KPI Definition Sheet Tab:
Contains detailed information about each KPI, including its name, group, unit, formula, and clear definitions. This section ensures that everyone involved in the recruitment process understands what each KPI represents and why it’s being tracked.
This Excel-based dashboard is a comprehensive tool designed to provide actionable insights into every stage of the recruitment process, enhancing overall recruitment efficiency and success.