Unlock the full potential of your sales data with the Regional Sales Analysis Dashboard in Power BI. Designed for dynamic sales analysis, this dashboard integrates seamlessly with Excel, providing a comprehensive tool for visualizing sales trends, profitability, and performance metrics across various regions and dimensions.
Key Features of the Regional Sales Analysis Dashboard
Page Navigator:
- Enhances user experience with a simple left-side navigation interface, allowing for swift movement across six distinct pages of the dashboard.
Overview Page:
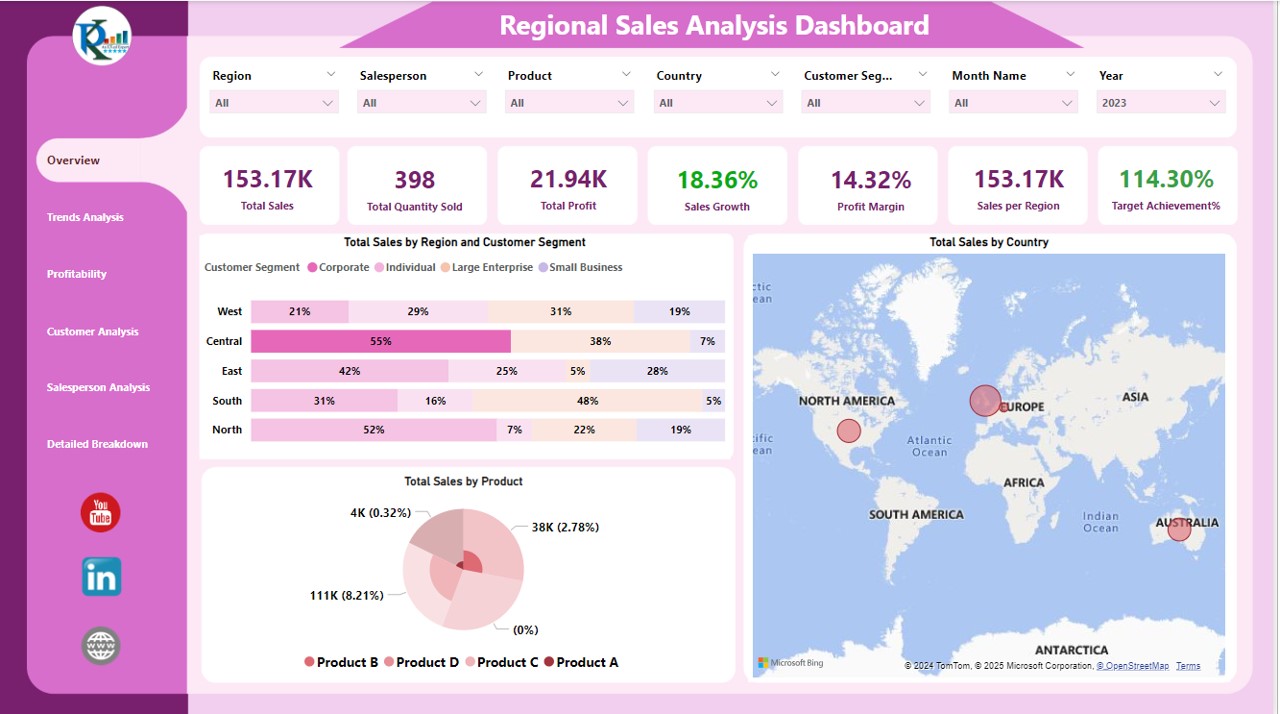
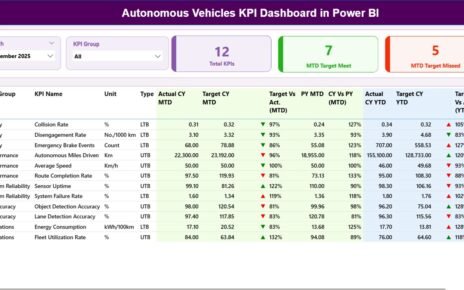
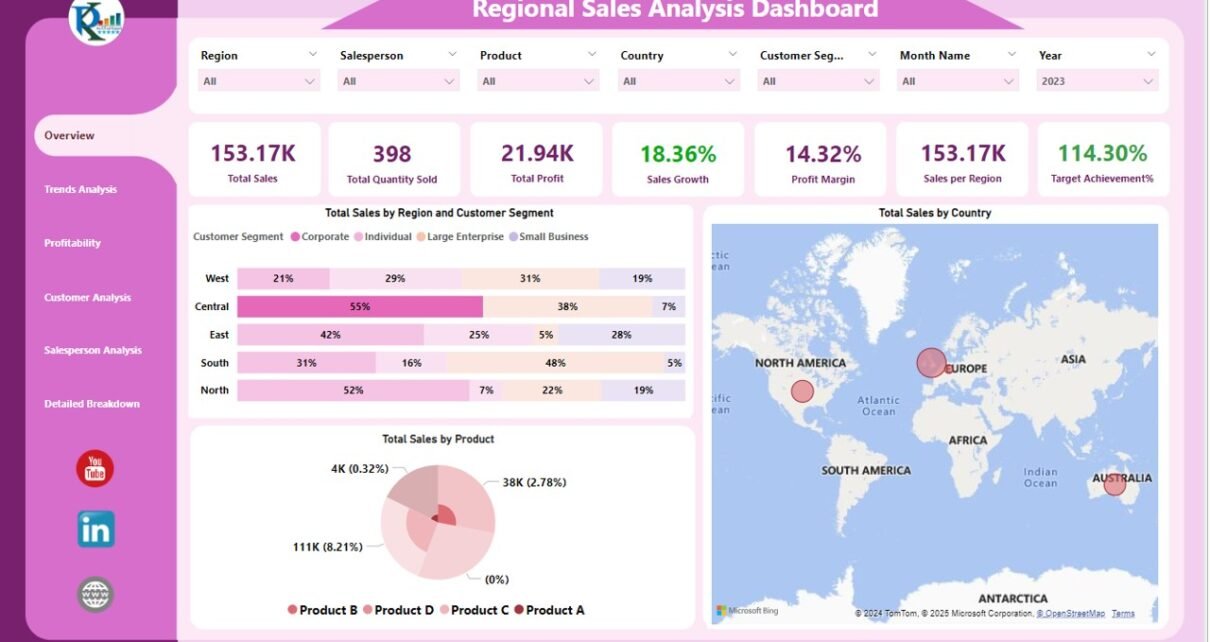
- Acts as the command center displaying crucial metrics such as Total Sales, Total Quantity Sold, and Profit Margins through intuitive cards and charts like the 100% Stacked Bar Chart for sales by region, a Map for country-wise sales, and a Pie Chart for product-based analysis.
Trends Analysis:
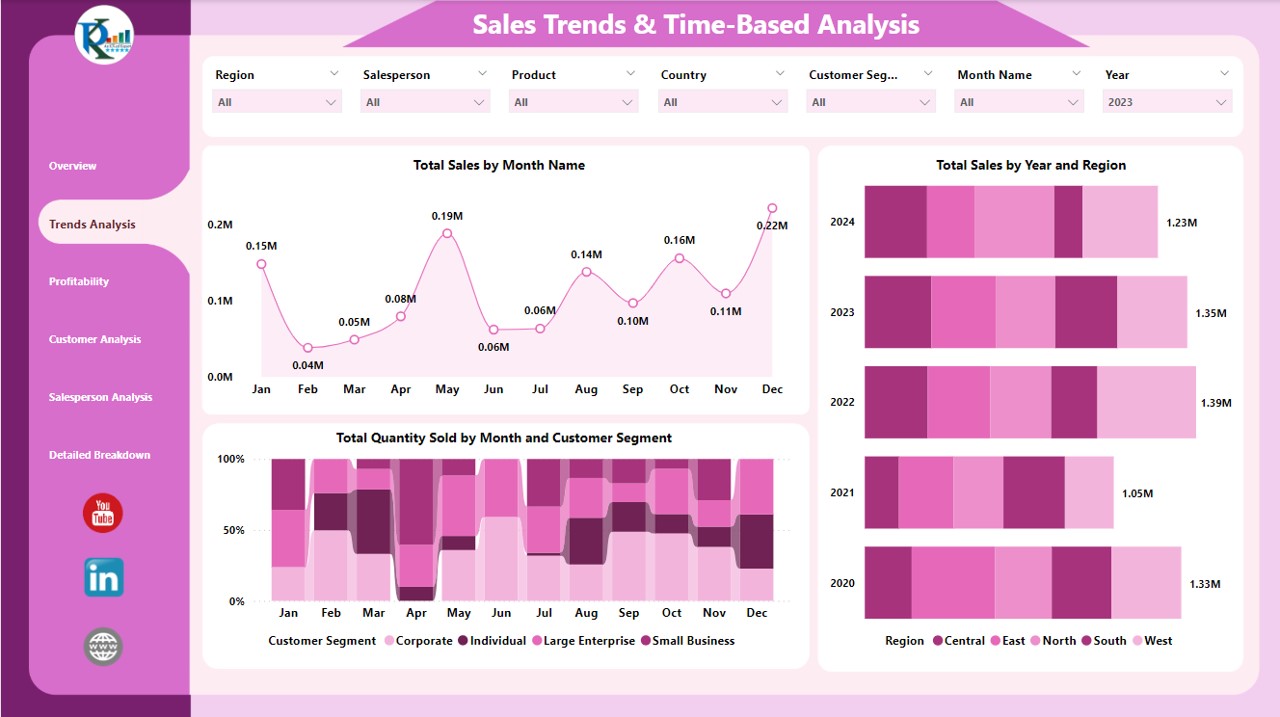
- Offers detailed insights with visualizations like the Area Chart for monthly sales, and Stacked Bar Charts for annual regional sales comparisons, helping identify emerging trends.
Profitability:
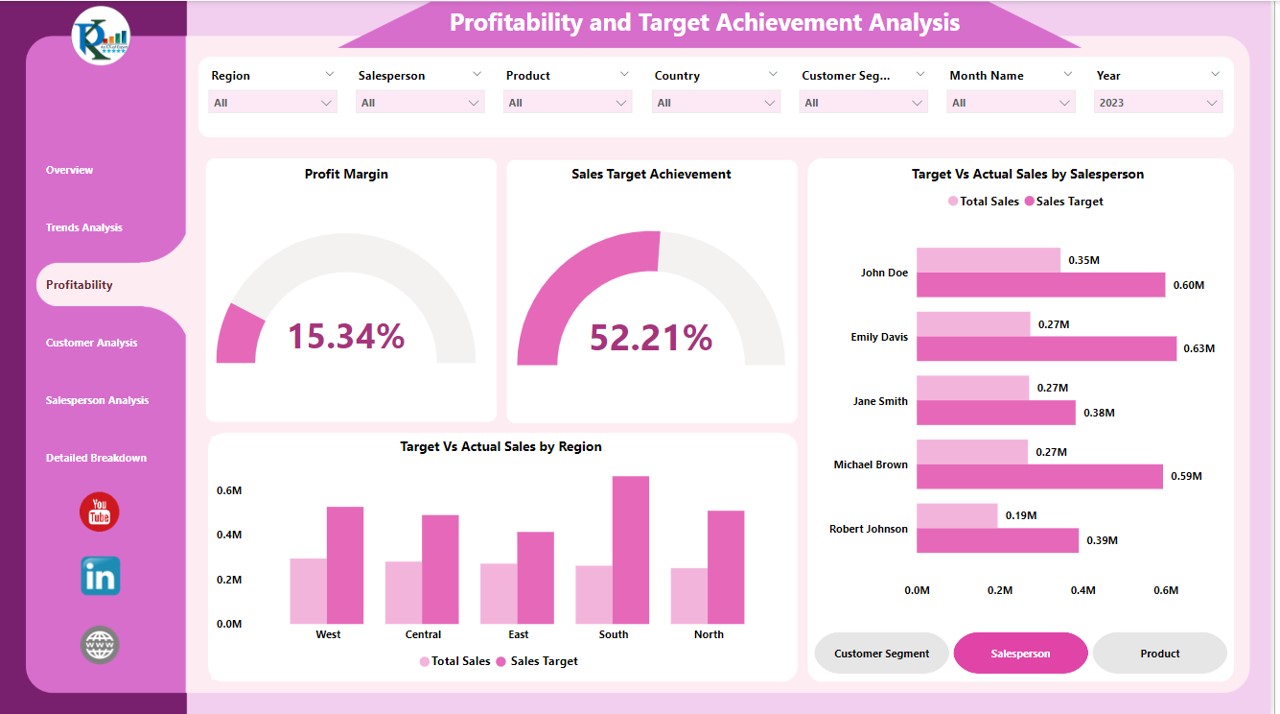
- Focuses on financial health using Gauge Charts to depict profit margins and sales target achievements, alongside comparative bar charts for target versus actual sales by salesperson and region.
Customer Analysis:
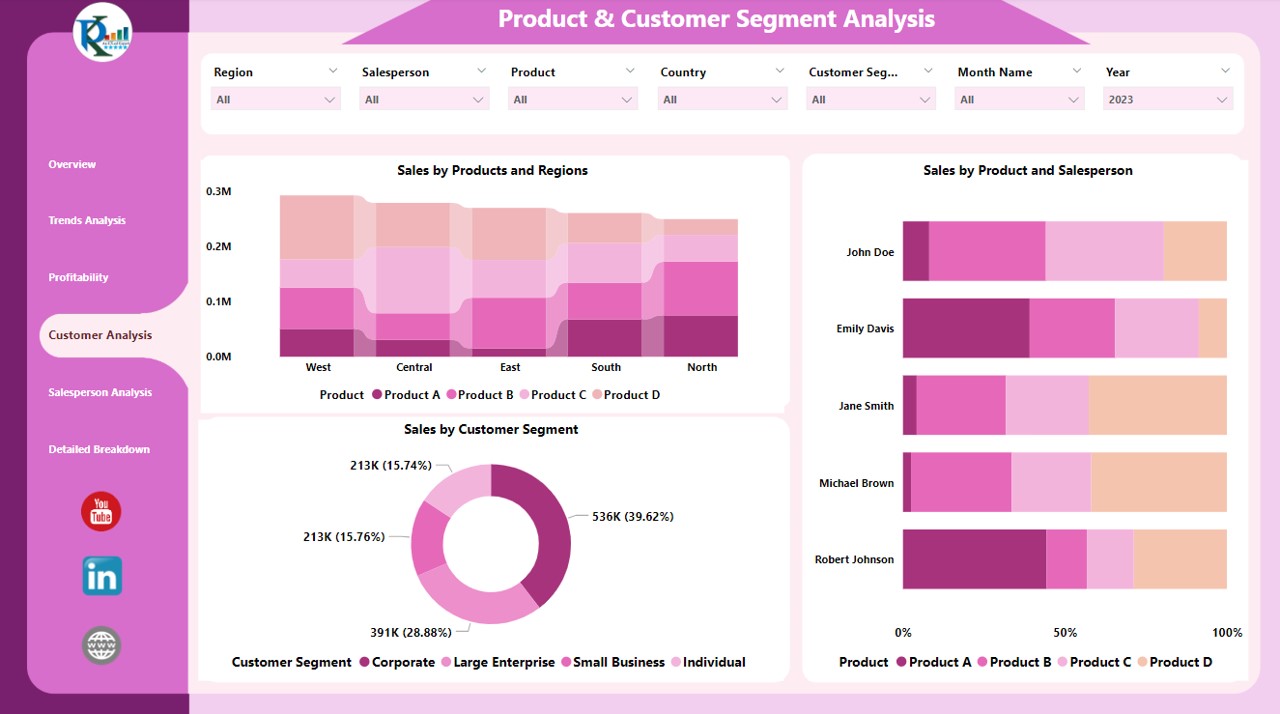
- Provides a deep dive into customer segments with charts that break down sales by product, region, and salesperson, offering a granular look at market penetration.
Salesperson Analysis:
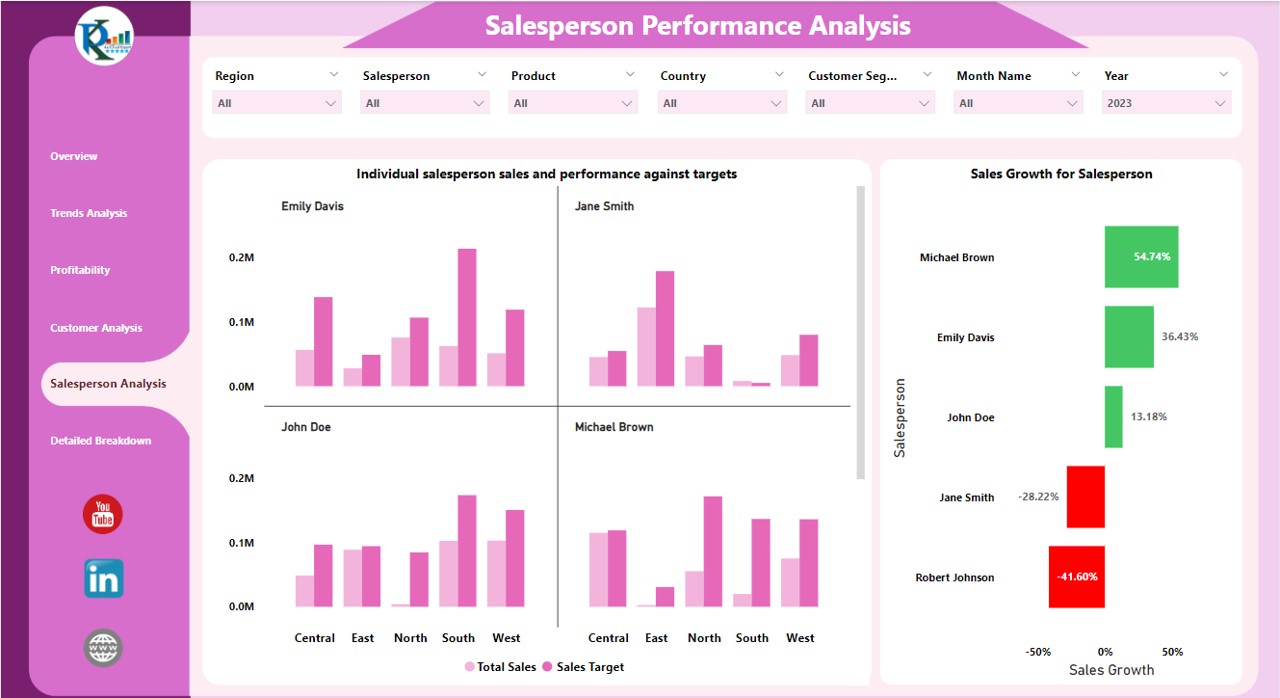
- Evaluates individual and team performance against set targets with multiple clustered column charts, assessing sales growth and contributions.
Detailed Breakdown:
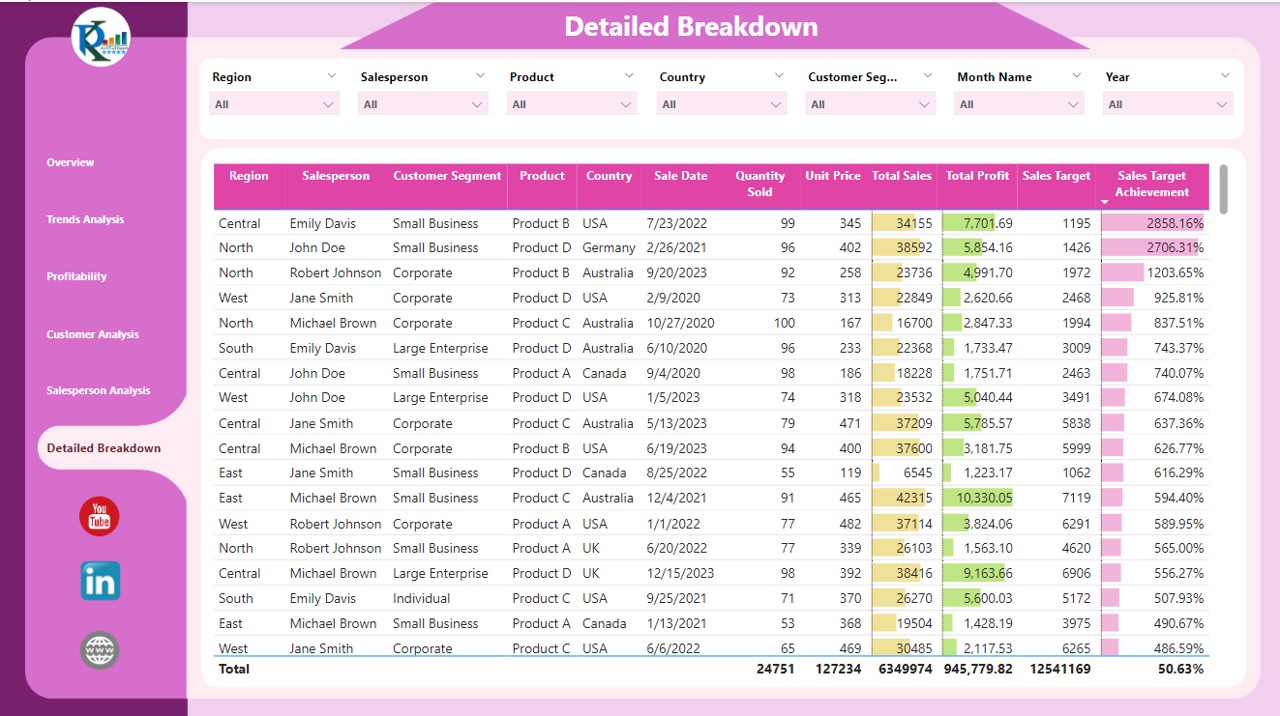
- Furnishes a meticulous table listing sales data by various demographics, including sales date, quantity sold, and profitability, to support detailed analytical reviews.