The Renewable Resource KPI Dashboard in Excel is a powerful and ready-to-use template designed to help businesses track and analyze key sustainability metrics efficiently. This user-friendly dashboard enables real-time performance monitoring, allowing organizations to measure energy consumption, carbon footprint, water usage, and other renewable resource KPIs. With interactive visuals, automated calculations, and structured data entry, this Excel file simplifies KPI management and decision-making for improved resource optimization.
Key Features of the Renewable Resource KPI Dashboard:
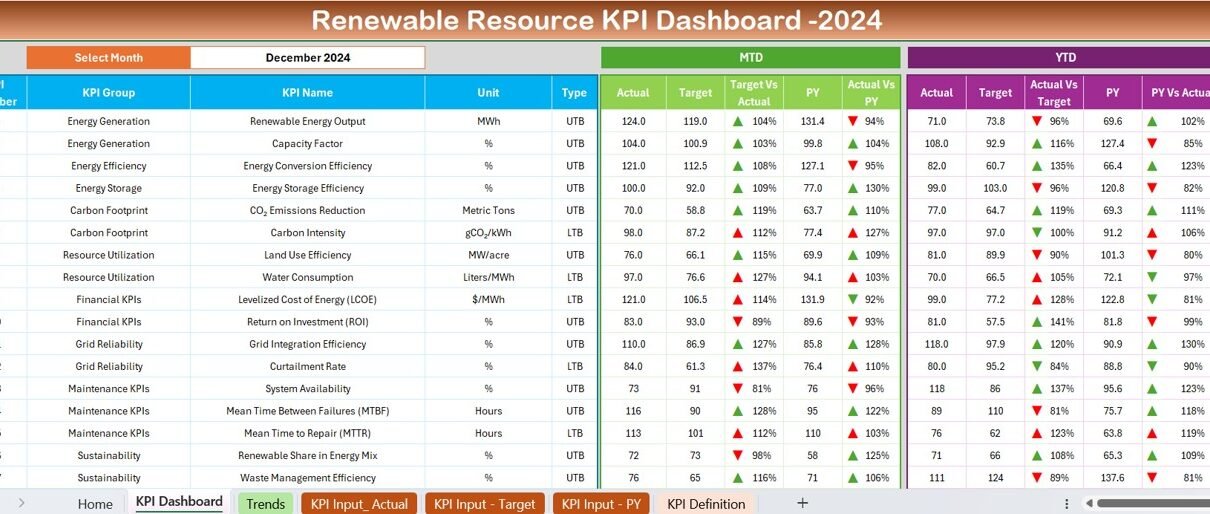
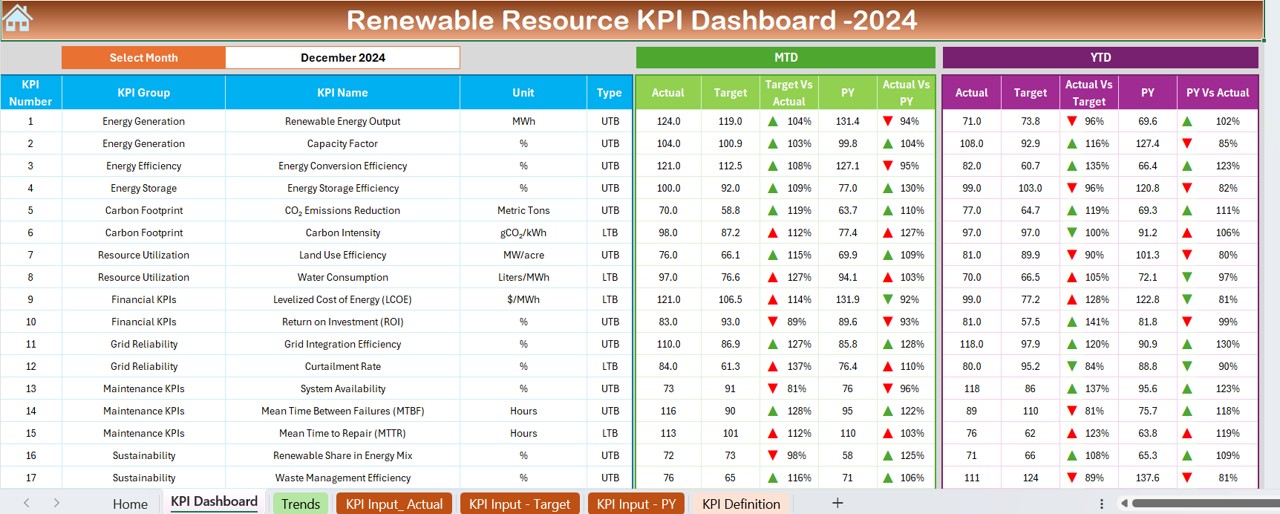
Comprehensive Dashboard:
Displays MTD & YTD actual, target, and previous year data with interactive drop-downs and conditional formatting indicators.
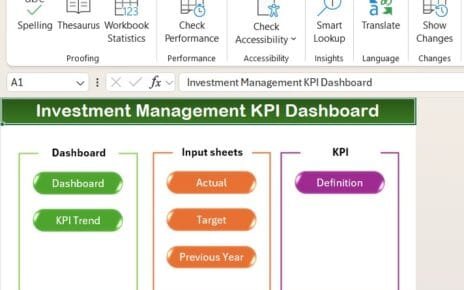
7 Structured Worksheets:
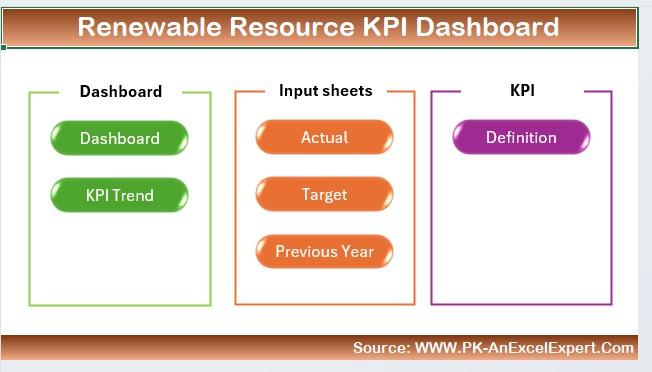
Organized into Home, Dashboard, KPI Trend, Actual Input, Target, Previous Year Data, and KPI Definition sheets for seamless data tracking.
Automated Calculations:
Dynamic updates based on selected month (D3), providing instant insights into performance trends.
KPI Trend Analysis:
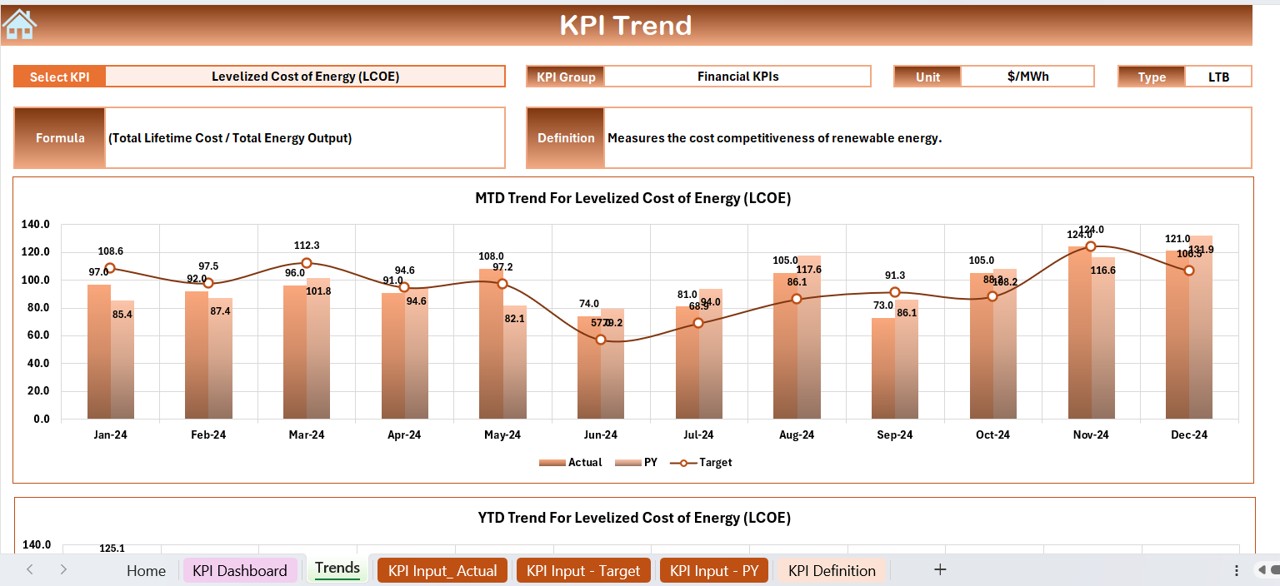
Dedicated KPI trend charts to visualize actual vs. target vs. previous year data.
Customizable KPI Definitions:
Includes KPI name, group, unit, formula, and type (Upper or Lower the Better) to ensure accurate measurement and analysis.
Historical Data Comparison:
Allows users to track performance against previous years, enabling better forecasting and strategic planning.
User-Friendly Navigation:
Home sheet with quick-access buttons to jump between key sections for effortless usability.