Returns Management KPI Dashboard in Excel. This meticulously crafted template is designed to provide clear visibility into your return metrics, empowering you to enhance efficiency and decision-making across your operations.
Key Features of the Returns Management KPI Dashboard:
Home Sheet with Navigation Buttons:
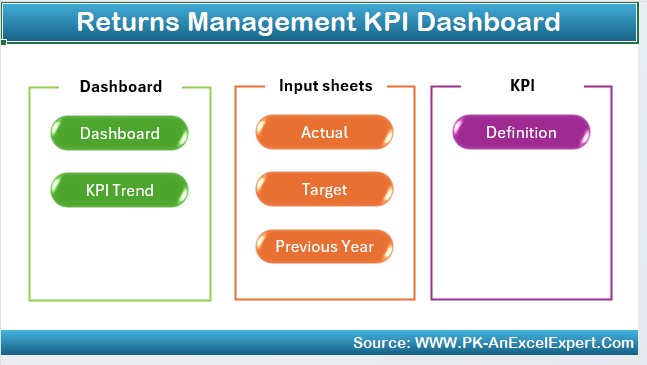
- Jump easily to any section of the dashboard through the home sheet, which features 6 intuitive buttons for superior navigation.
Dynamic Dashboard Sheet Tab:
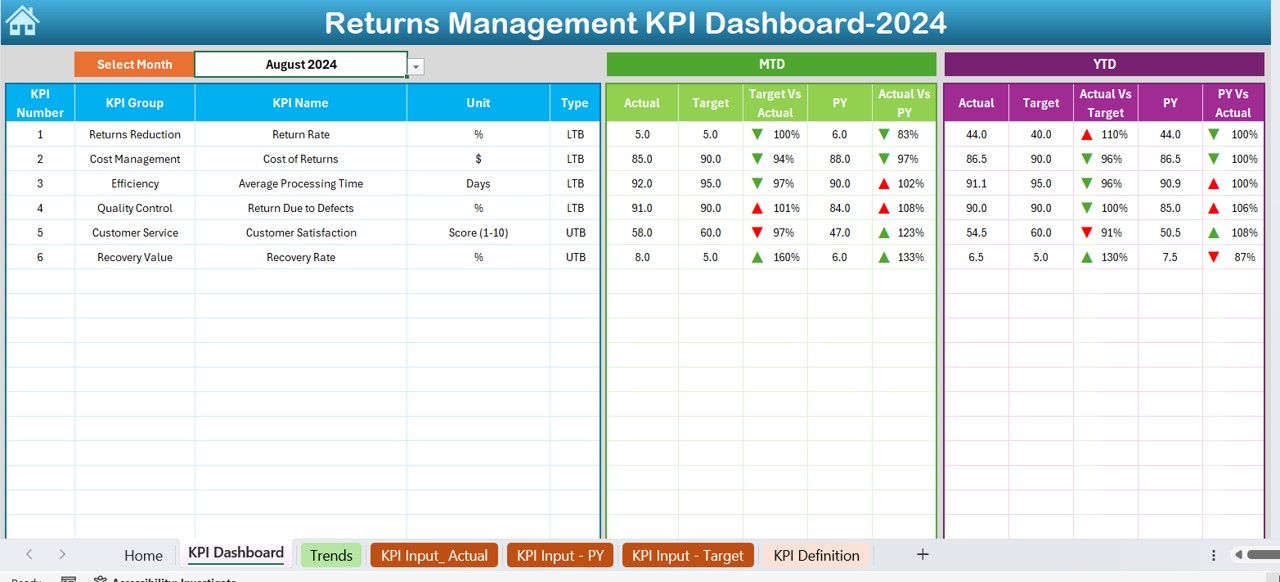
- Display comprehensive KPI data including MTD and YTD actuals, targets, and previous year comparisons, all adjustable by month from a simple dropdown menu. Visual indicators via conditional formatting provide immediate insights into performance against targets.
KPI Trend Analysis:
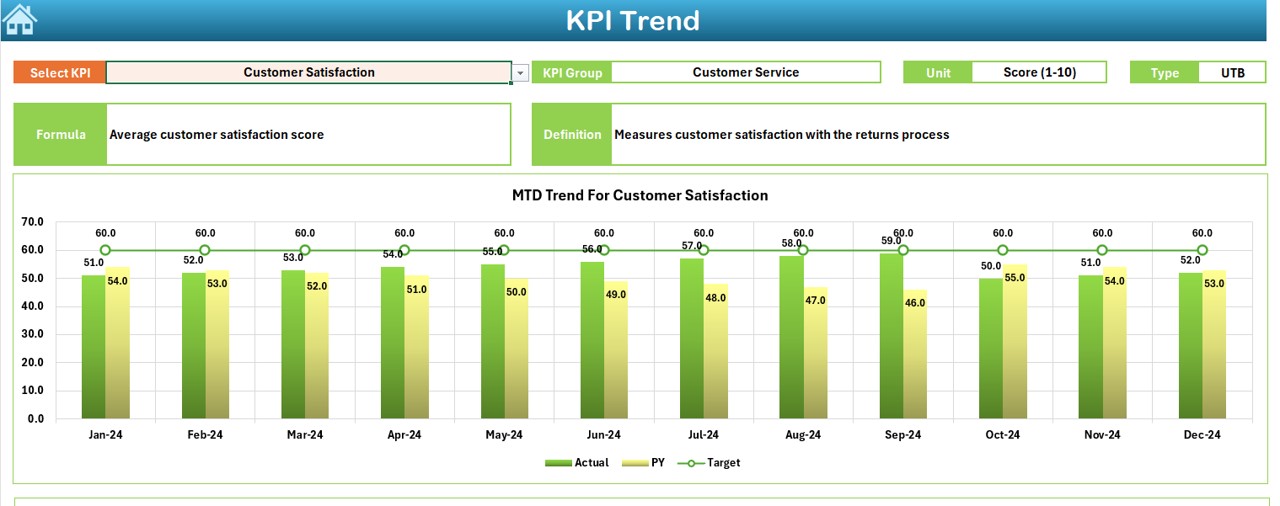
- Visualize performance trends over time by selecting KPIs through a dropdown menu. Includes detailed metrics such as unit, type, formula, and definitions essential for accurate tracking.
Actual Numbers and Target Input Sheets:
- Enter and modify actual and target numbers for detailed tracking of monthly and yearly performance. This feature ensures data accuracy and provides a basis for performance analysis.
Historical Data Comparison:
- Maintain and access previous year’s data for year-over-year performance analysis, helping you understand trends and inform future strategies.