Boost your revenue tracking and business performance with our Revenue Growth KPI Dashboard in Excel. This ready-to-use template provides a comprehensive and visually appealing dashboard to monitor key revenue metrics, compare actual vs. target figures, and analyze historical trends with ease. Designed for business professionals, analysts, and decision-makers, this Excel dashboard enables real-time insights and data-driven decisions for maximizing growth.
Key Features of the Revenue Growth KPI Dashboard
7 Pre-Designed Worksheets
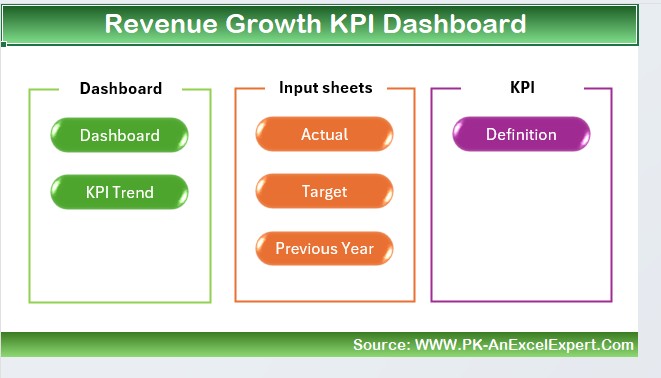
Includes Home, Dashboard, KPI Trend, Actual Numbers Input, Target, Previous Year Data, and KPI Definition sheets for complete revenue tracking.
Interactive Dashboard
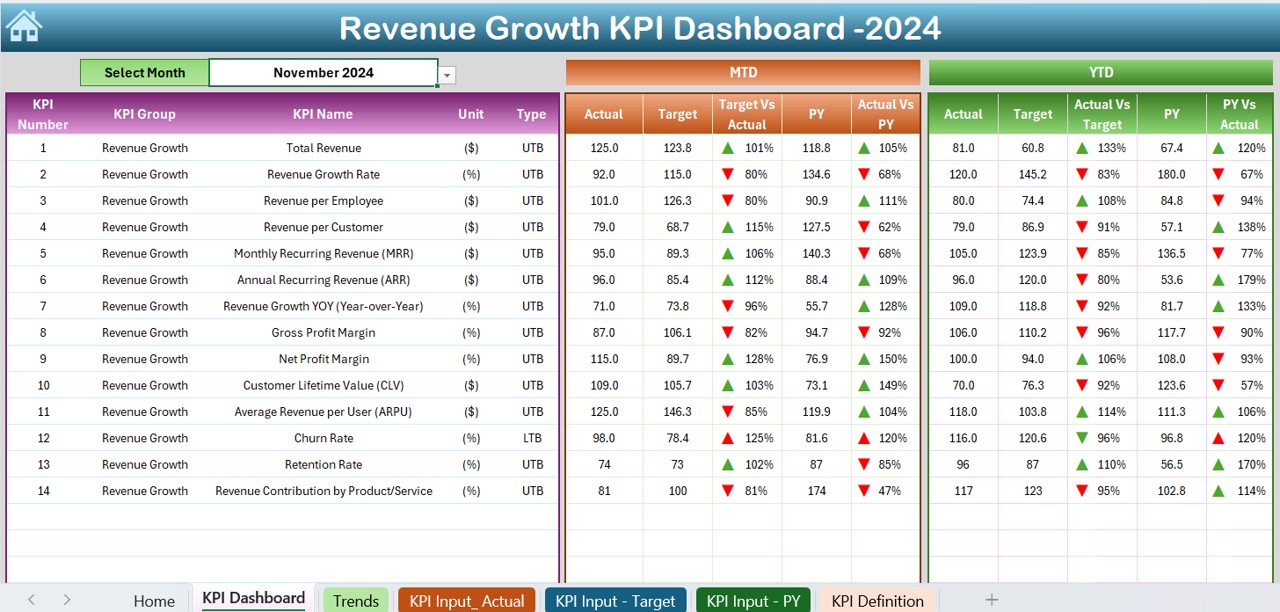
Select a month from the drop-down in D3, and the dashboard dynamically updates MTD and YTD actual, target, and previous year figures with conditional formatting arrows for trend visualization.
KPI Trend Analysis
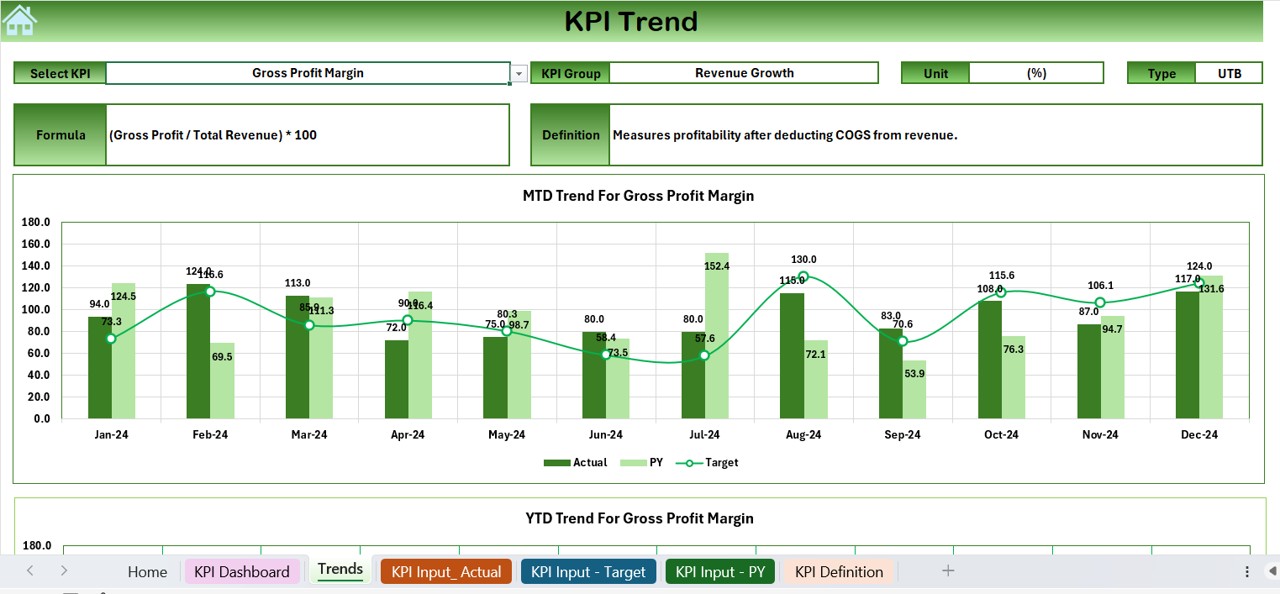
Easily track MTD and YTD revenue trends through interactive charts. Includes KPI type (Lower is Better or Upper is Better), unit, and formula.
Customizable Data Input Sheets
Update actual revenue, target revenue, and past year data in dedicated sheets to instantly reflect changes across the dashboard.
One-Click Navigation
The Home sheet features quick-access buttons, making navigation between sheets effortless.
Accurate Revenue Insights
Get a clear comparison of actual performance vs. targets, allowing for informed decision-making.
Fully Automated & User-Friendly
No coding required! The dashboard is formula-driven, ensuring seamless updates with minimal effort.