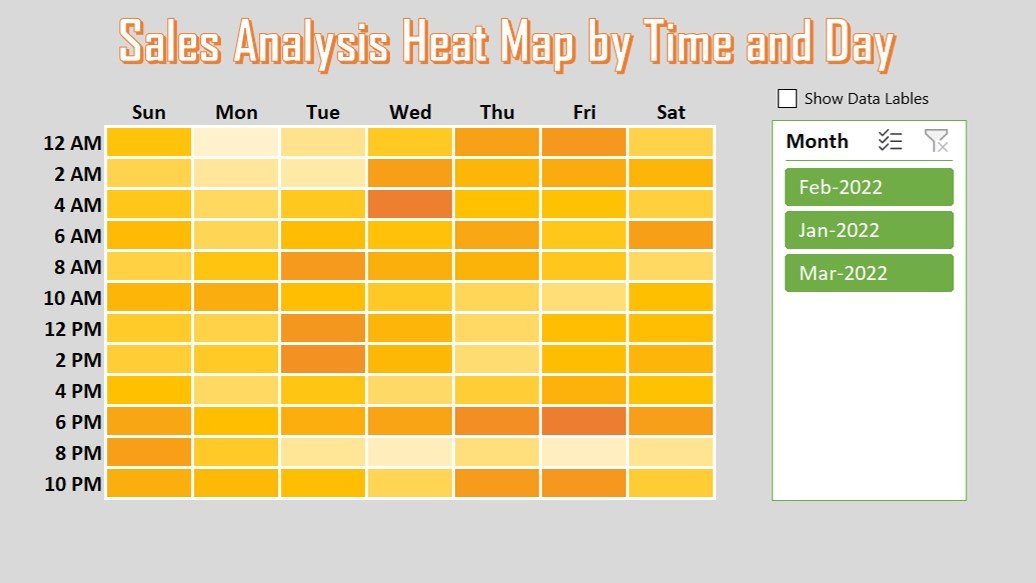
Analyzing sales data by time and day can provide valuable insights into peak performance periods. The Sales Analysis Heat Map by Time and Day in Excel offers a dynamic visualization to identify your busiest hours and days, helping you optimize business strategies.
Key Features:
- Interactive heat map with customizable data labels via Form Control Check Box.
- Visualizes peak sales periods by time and day for effective decision-making.
- Step-by-step video tutorial included for easy setup and customization.