Boost your Scrum team’s performance with this Scrum Team KPI Dashboard in Excel – a fully customizable and interactive dashboard designed to track and analyze key performance indicators (KPIs) efficiently. Whether you need to monitor sprint progress, velocity, or backlog health, this dashboard offers a structured and data-driven approach to agile performance management.
Key Features of Scrum Team KPI Dashboard:
User-Friendly Interface:
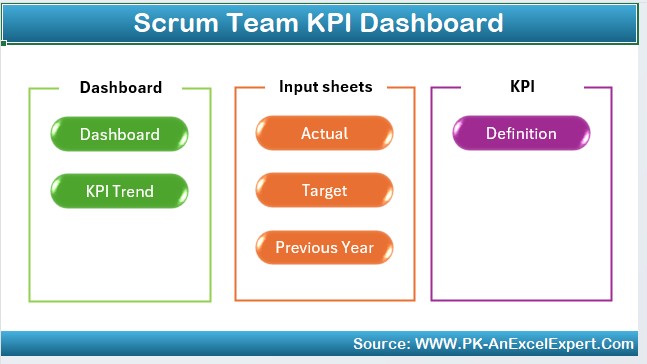
Comes with a Home Sheet featuring navigation buttons for seamless access to all sections.
Comprehensive KPI Tracking:
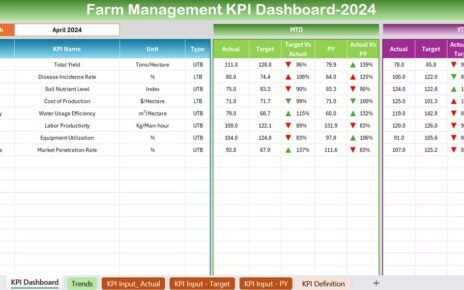
Displays MTD (Month-to-Date) and YTD (Year-to-Date) KPIs with Actual, Target, and Previous Year comparisons.
Dynamic Dashboard:
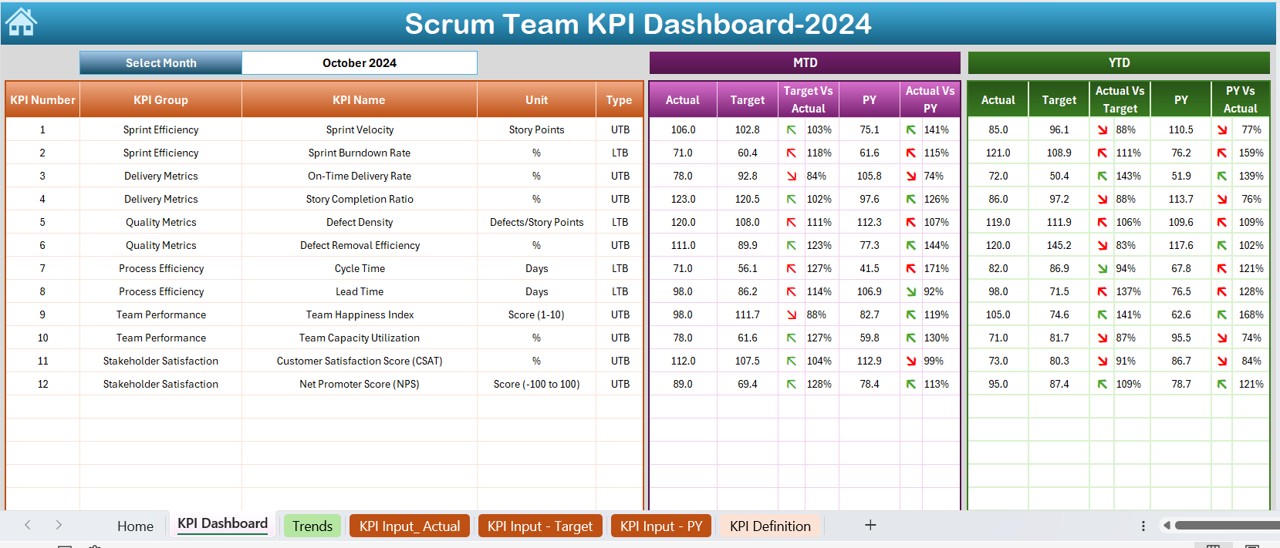
Select the desired month from a drop-down, and the dashboard updates automatically.
Trend Analysis:
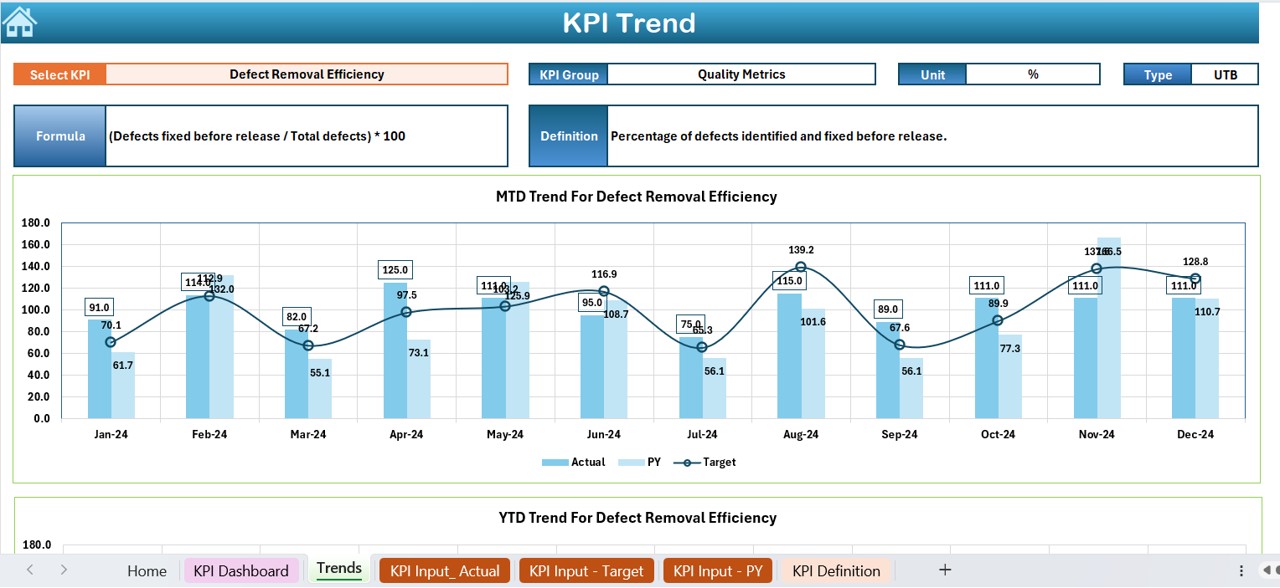
View KPI performance trends with intuitive charts and conditional formatting indicators (Up/Down arrows).
Easy Data Input:
Dedicated sheets for Actual Numbers, Targets, and Previous Year Data to ensure accurate reporting.
KPI Details & Formulas:
A KPI Definition Sheet where you can enter KPI Name, Group, Unit, Formula, and Definition.