In today’s digital marketing landscape, the success of SEO strategies and content performance relies on data and metrics. An SEO Content Performance KPI Dashboard provides a clear view of how well content performs across various SEO channels. This article will explore the key features and benefits of using an SEO Content Performance KPI Dashboard, list the essential KPIs, and guide you through the process of effectively implementing such a dashboard for your content strategies.
Key Features of the SEO Content Performance KPI Dashboard
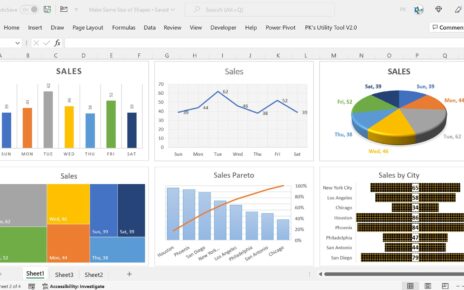
This ready-to-use template for SEO Content Performance KPI Dashboard includes seven worksheets designed to simplify and enhance tracking:
1. Home Sheet
The Home Sheet acts as an index, with six buttons that allow you to jump to the respective sheet. It provides a bird’s-eye view of all the content-related KPIs.

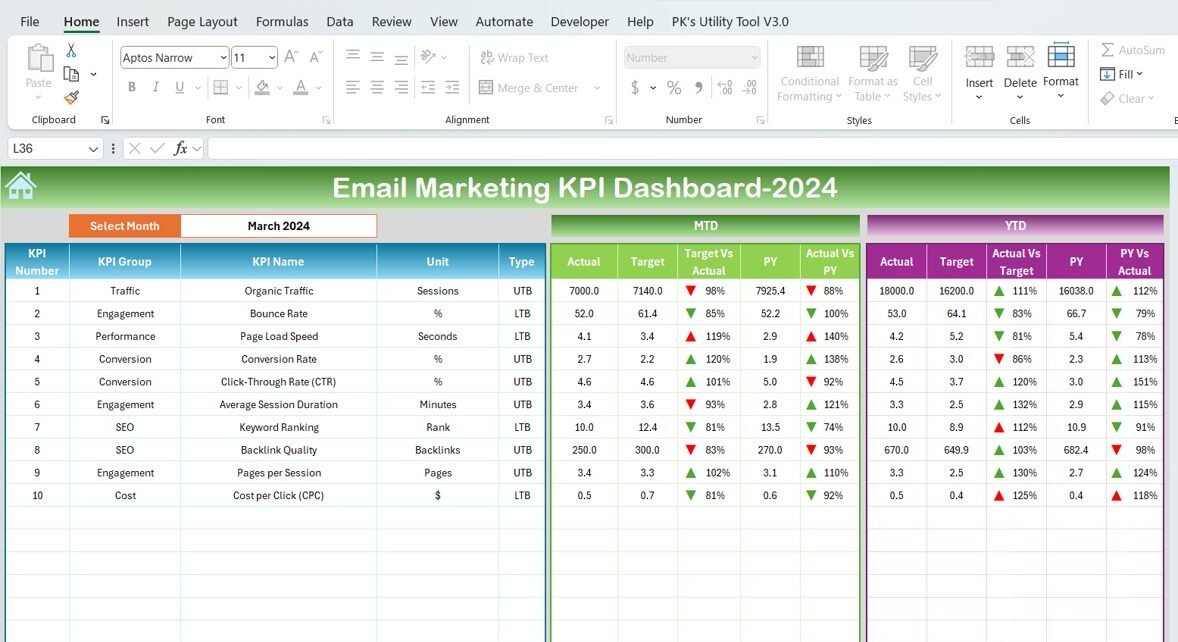
2. Dashboard Sheet Tab
The Dashboard Sheet Tab is the heart of the SEO Content Performance KPI Dashboard. Here, you can see the MTD (Month-To-Date) Actual, Target, Previous Year Data, and more. Key features include:
- KPI comparisons: Target vs Actual and Previous Year vs Actual, with conditional formatting to highlight differences using up/down arrows.
- Month selection: The dropdown allows you to select any month, which automatically updates the entire dashboard for that month.
- YTD Comparison: In addition to MTD, you can also track Year-To-Date (YTD) performance.

3. KPI Trend Sheet Tab
The KPI Trend Sheet helps in selecting KPIs and visualizing their trends. Here, you can:
- View the KPI Group, Unit, Type, Formula, and Definition of each KPI.
- Understand whether “Lower is Better” or “Upper is Better” for each metric.

4. Actual Numbers Sheet Tab
This is where you input the actual numbers for each KPI for both YTD and MTD. By selecting the first month of the year, you can update data for the entire year accordingly.
5. Target Sheet Tab
In this sheet, you enter the target values for each KPI, both for the MTD and YTD. These targets are used to compare against actual numbers.
6. Previous Year Numbers Sheet Tab
Here, you input the same data as for the current year, but for the previous year. This allows you to compare your current performance against the past.
7. KPI Definition Sheet Tab
The KPI Definition sheet is a reference point where you can enter and view the full details of each KPI, including its name, group, unit, formula, and definition.