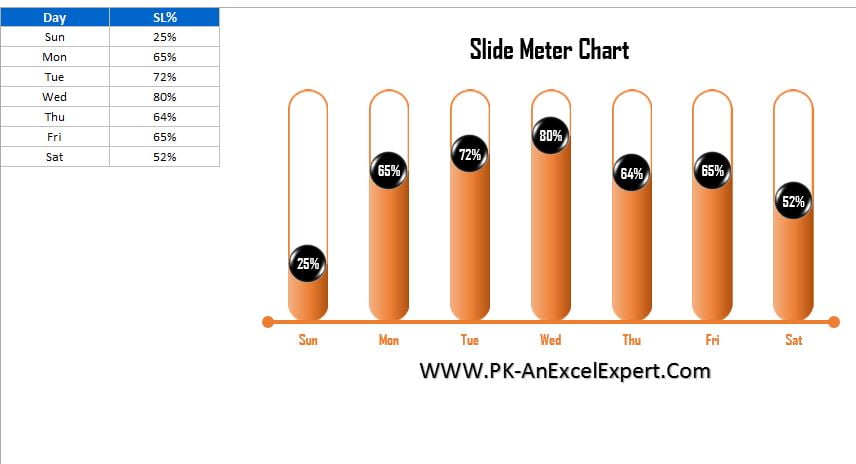
The Slide Meter Chart (Version-2) enhances the traditional KPI metric visualization by using semi-filled bars to represent performance levels. This updated version provides a visually striking addition to business dashboards, offering a clearer and more engaging way to display key performance indicators.
Key Features
- Semi-Filled Bar Design: Learn how to create and customize Slide Meter Charts with semi-filled bars to visually depict KPI metric performance levels.
- Enhanced Visual Appeal: Explore a more eye-catching chart design that improves the aesthetic and clarity of performance data in business dashboards.
- Practical Application: Understand the practical application of Slide Meter Charts (Version-2) in various business contexts, enhancing data interpretation and decision-making processed