Discover the enhanced capabilities of our Slide Meter Chart (Version-3), the latest iteration in our series of Excel-based visualization tools. This version integrates advanced conditional formatting to provide immediate visual cues on performance, enabling quicker decision-making and more effective presentations of KPI metrics.
Key Features:
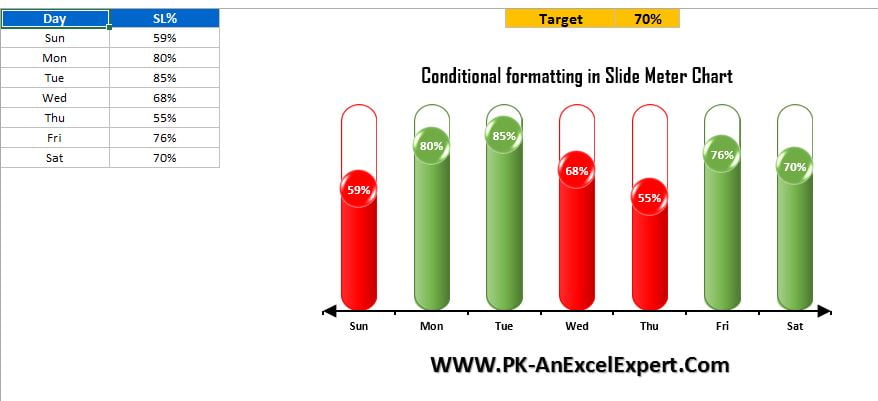
- Advanced Conditional Formatting: Automatically changes color based on performance metrics; if the Service Level is below target, the indicator turns red, and if it meets or exceeds the target, it turns green.
- Evolved Visualization Techniques: Builds on the solid and semi-filled bars used in previous versions by adding dynamic, data-driven color coding to enhance readability and impact.
- Customizable and Scalable: Tailor the visual display to fit your specific needs, whether for detailed monthly reviews or high-level annual summaries, ensuring that key data stands out effectively.
Read the detailed blog post


