The Small Business KPI Dashboard in Excel is a powerful and ready-to-use template designed to help small businesses monitor their key performance indicators effectively. With its intuitive layout and dynamic features, this dashboard simplifies performance tracking, enabling data-driven decisions for business growth.
Key Features
Home Sheet for Easy Navigation
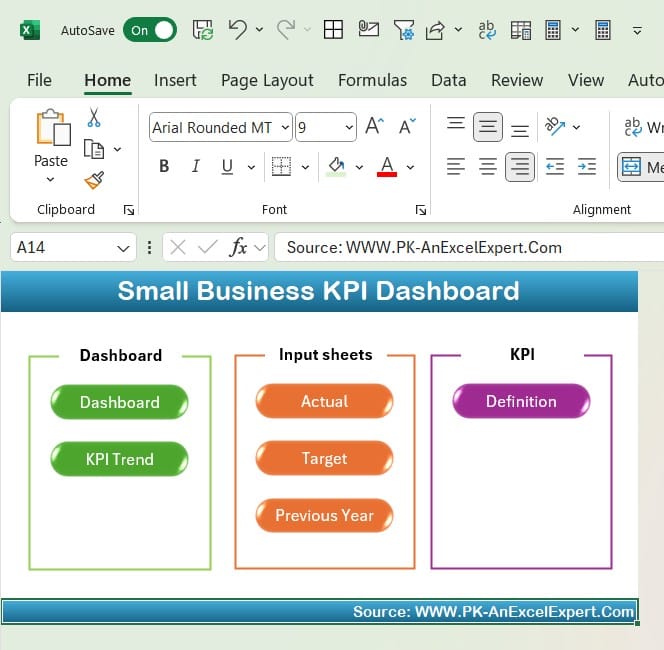
- Includes six buttons for seamless access to all sheets.
Interactive Dashboard Sheet
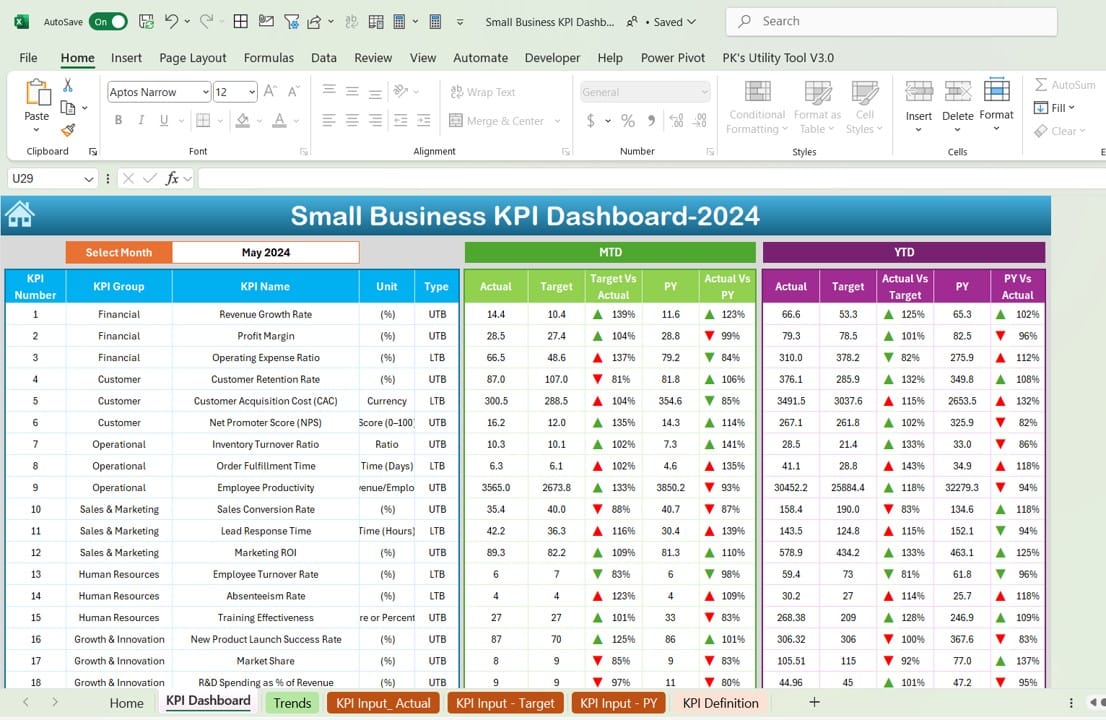
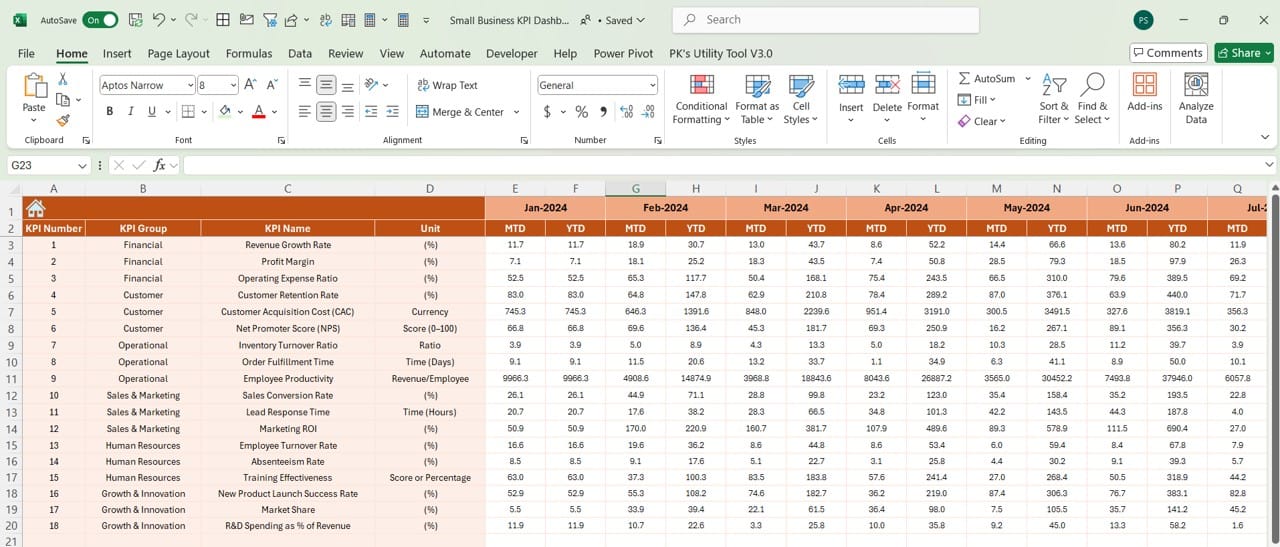
- View MTD and YTD metrics for Actuals, Targets, and Previous Year data.
- Dynamic month selection with conditional formatting for visual indicators like up/down arrows.
KPI Trend Analysis
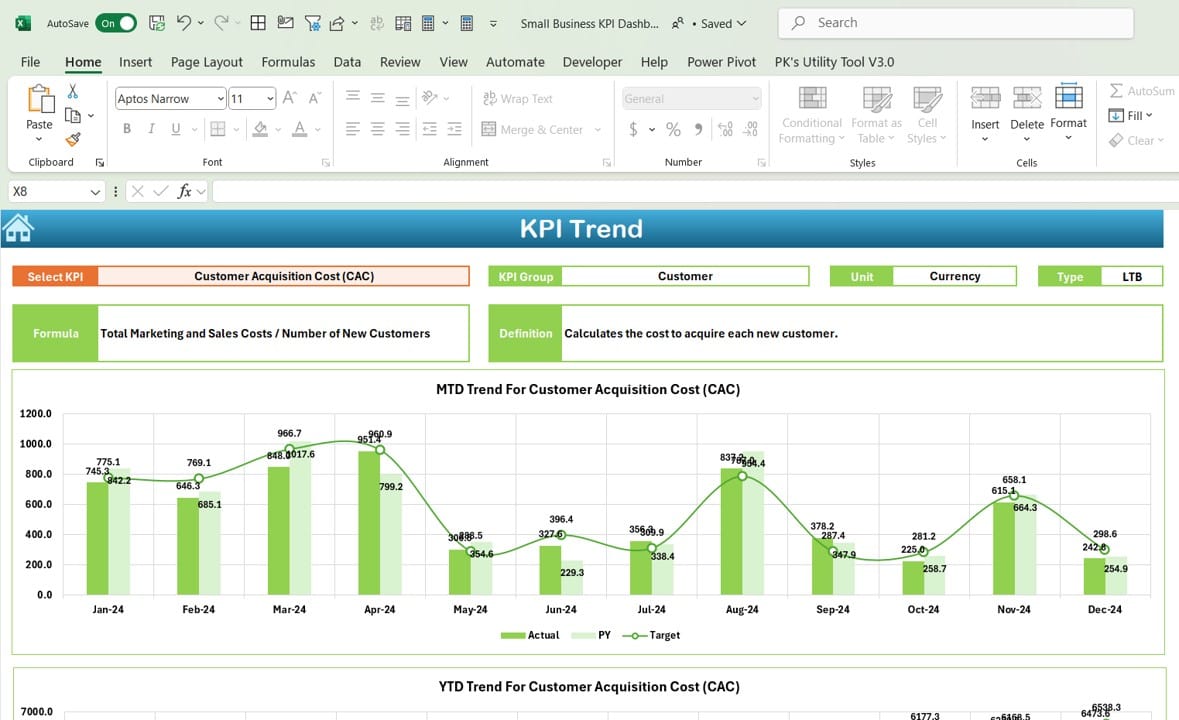
- Analyze trends with MTD and YTD charts.
- Comprehensive KPI details, including Group, Unit, Type, and Formula.
Data Input Sheets
- Separate sheets for entering Actual, Target, and Previous Year numbers for precise tracking.
Customizable KPI Definitions
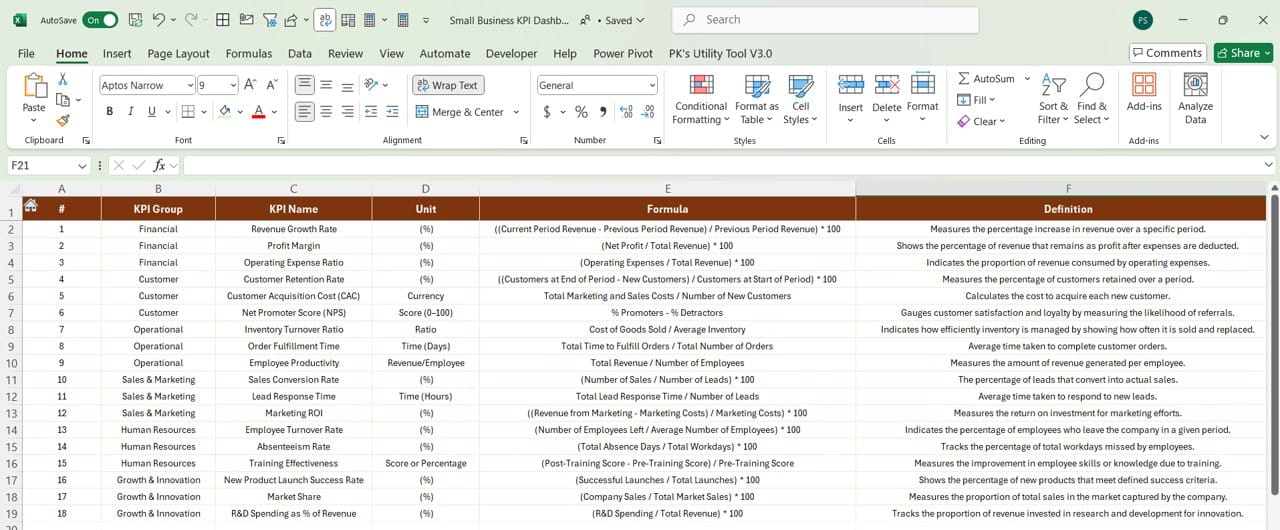
- Easily define KPIs with their Group, Unit, and Formula for complete clarity.
Read the detailed blog post