The Small Business KPI Dashboard in Power BI is a ready-to-use, dynamic solution designed to help small businesses track and analyze their key performance indicators (KPIs) effectively. With seamless data integration from an Excel file, this dashboard provides a comprehensive view of business performance, trends, and target achievements—empowering decision-makers with real-time insights.
Key Features of the Small Business KPI Dashboard in Power BI
3 Interactive Dashboard Pages
- Summary Page, KPI Trend Page, and KPI Definition Page for easy navigation.
Summary Page Insights
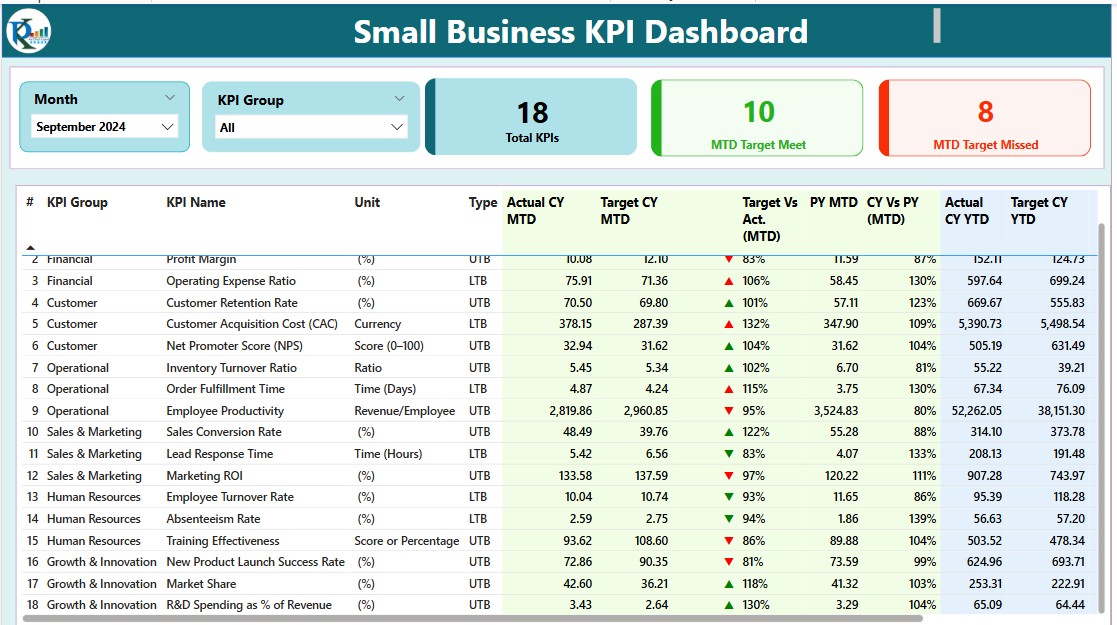
- Displays key metrics like Total KPIs, MTD Target Met, and MTD Target Missed, with clear visual indicators.
Trend Analysis
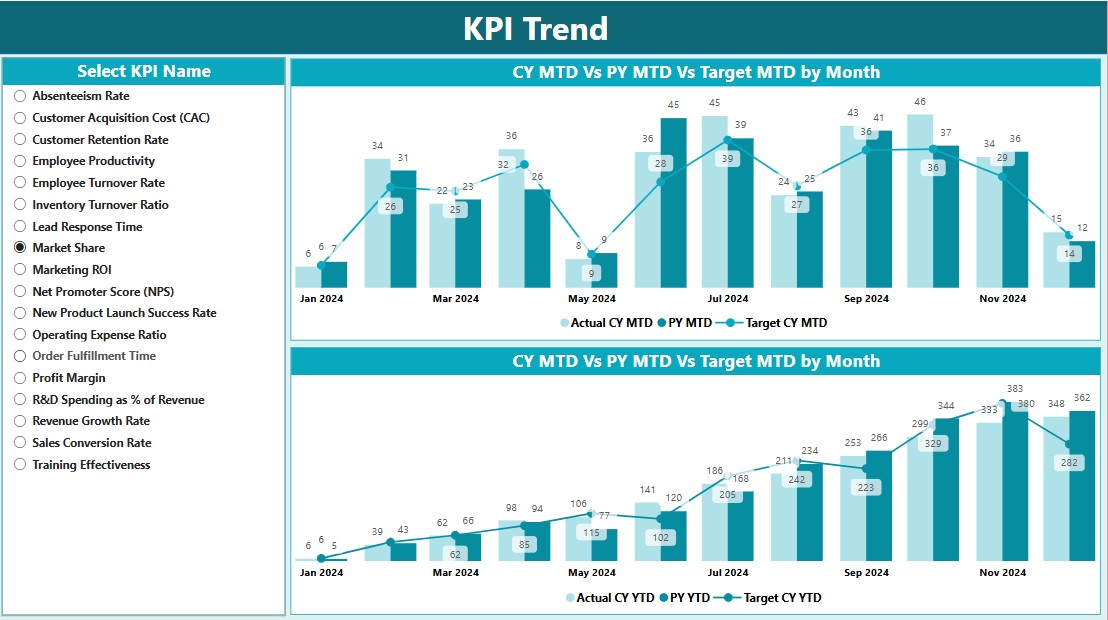
- Two combo charts to compare Current Year, Previous Year, and Target values for MTD and YTD.
Drill-Through Functionality
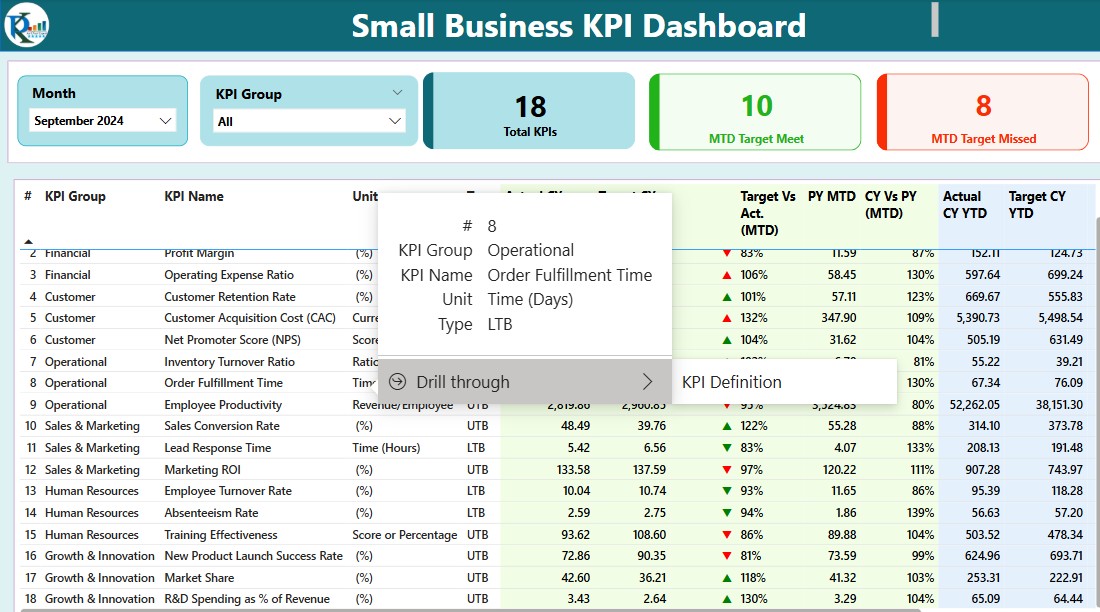
- Hidden KPI Definition Page for detailed KPI descriptions and formulas.
Excel-Based Data Source
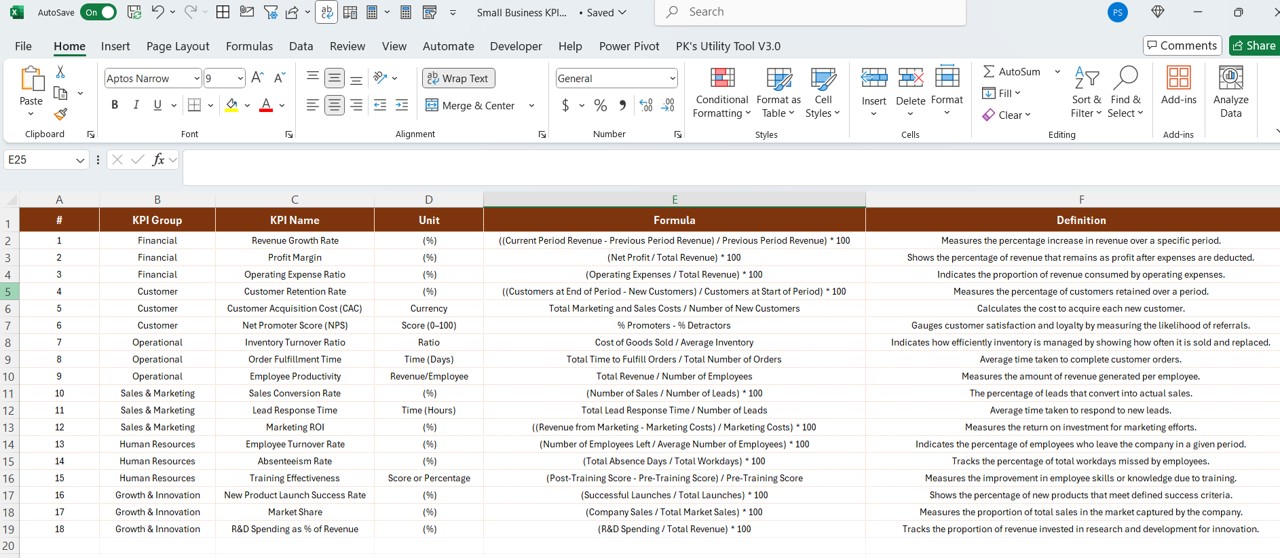
- Easily update actuals, targets, and KPI definitions through structured Excel worksheets.
User-Friendly Navigation
- Interactive slicers, KPI filters, and a back button for a seamless user experience.


