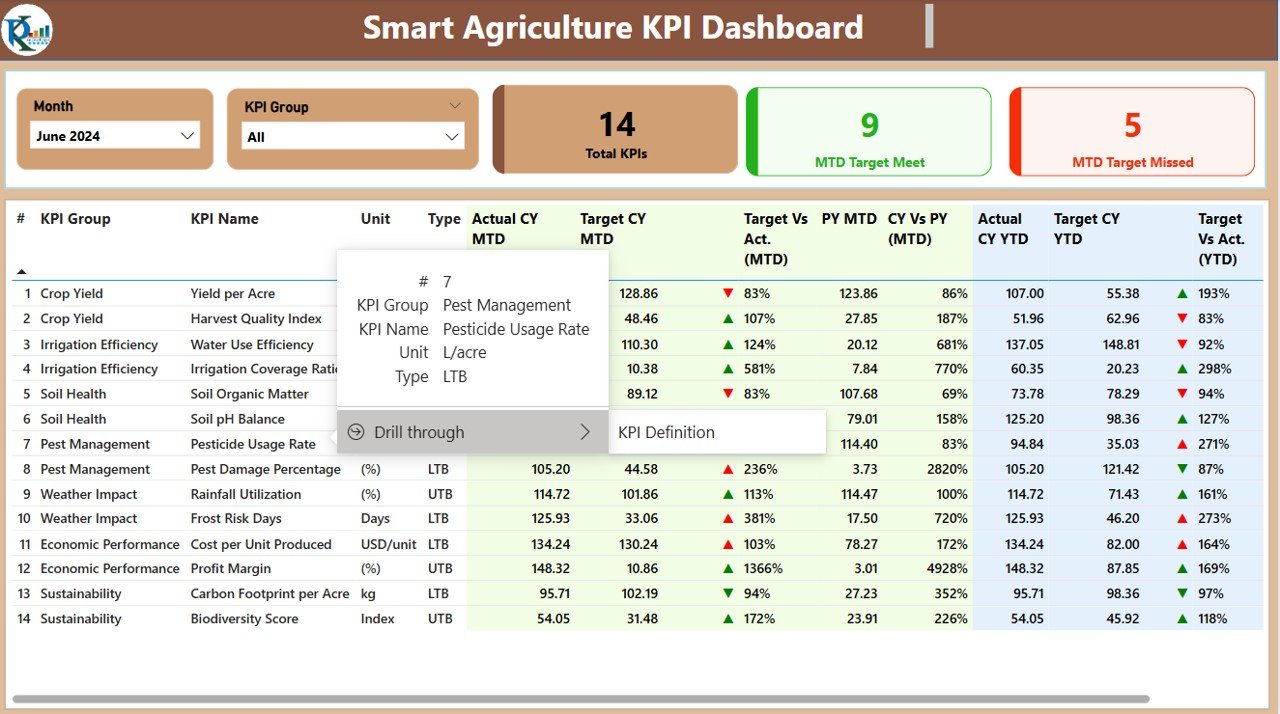
The Smart Agriculture KPI Dashboard in Power BI is a comprehensive, ready-to-use tool designed to help agricultural organizations monitor and optimize their operations. By offering a real-time view of key performance indicators (KPIs) like crop yields, resource usage, and operational efficiency, this dashboard empowers decision-makers to enhance productivity and sustainability. It provides detailed, data-driven insights that drive smarter farming practices, ensuring that both environmental and operational goals are met.
Key Features of the Smart Agriculture KPI Dashboard in Power BI:
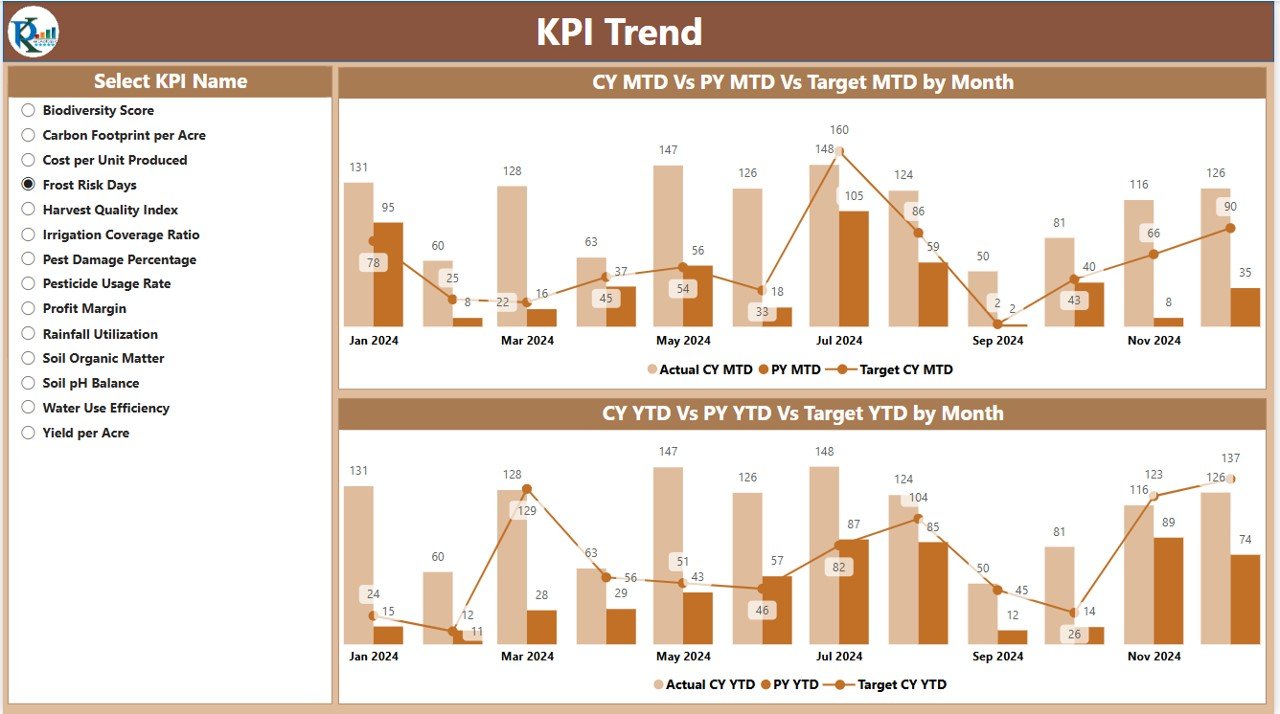
- Comprehensive Data Visualization: See a consolidated view of all agricultural metrics, providing actionable insights for better decision-making.
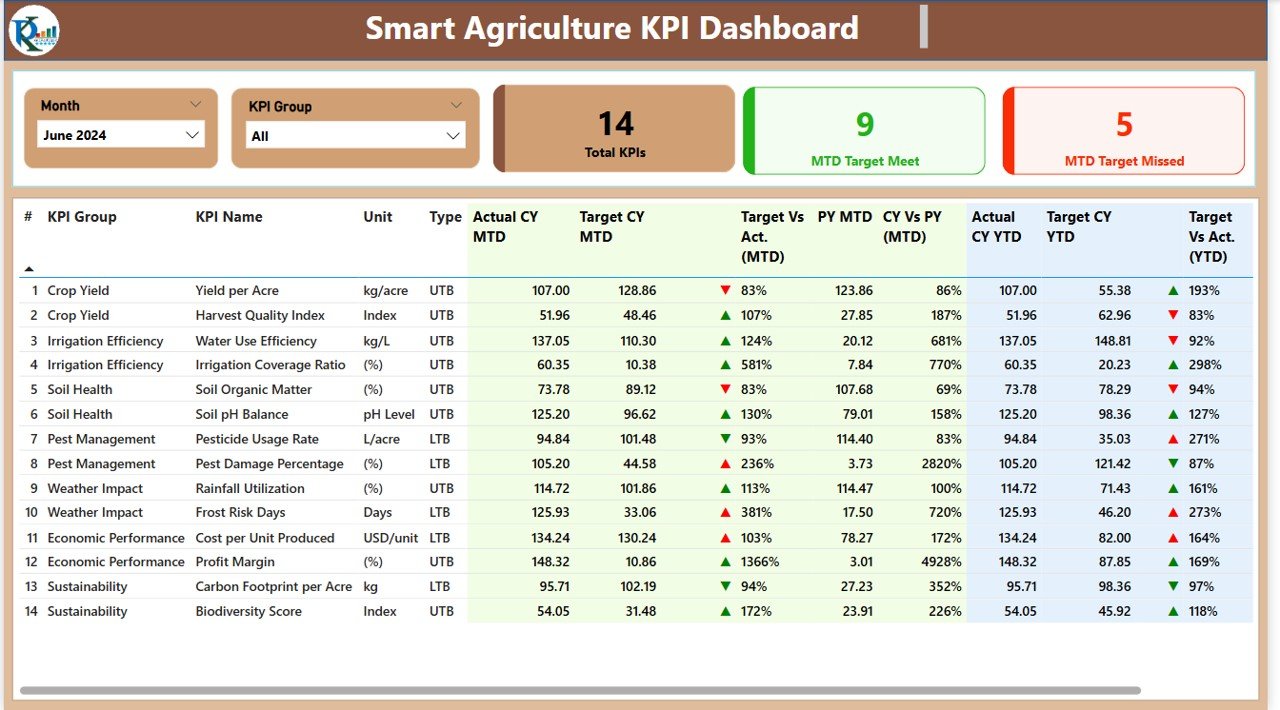
- Real-Time Monitoring: Track KPIs such as crop yield, resource usage, and environmental impact in real time for quick corrective actions.
- Customizable Metrics: Tailor the dashboard to meet your organization’s specific goals, from operational efficiency to resource conservation.