In today’s fast-paced digital world, measuring the effectiveness of social media campaigns and understanding the Return on Investment (ROI) can be challenging without the right tools. The Social Media ROI KPI Dashboard in Excel is the solution. This comprehensive, ready-to-use dashboard helps businesses track key performance indicators (KPIs) to evaluate and optimize social media performance. By leveraging this dashboard, businesses can make informed, data-driven decisions that boost their social media marketing efforts.
Key Features of the Social Media ROI KPI Dashboard
Our Social Media ROI KPI Dashboard in Excel is designed with several key features to help businesses streamline social media monitoring and maximize ROI. Below are the core elements:
Home Sheet:
Serves as an index, providing easy navigation through six buttons that link to the various sections of the dashboard.
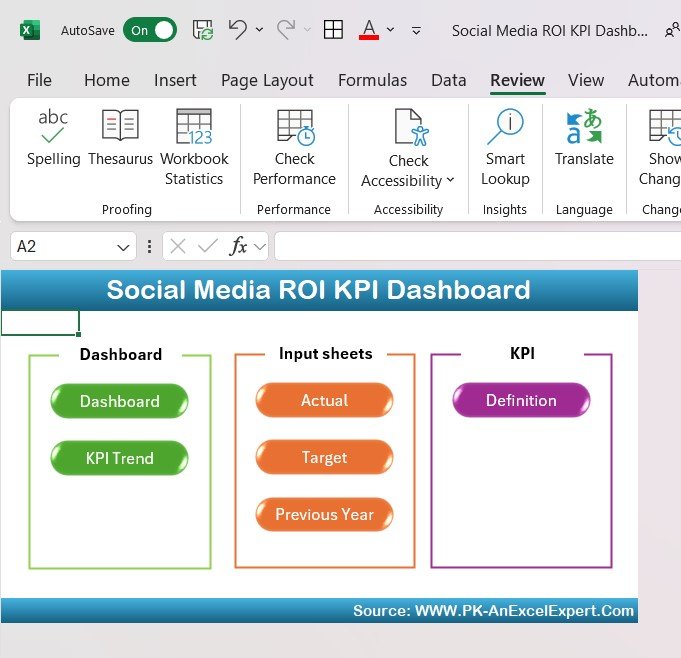
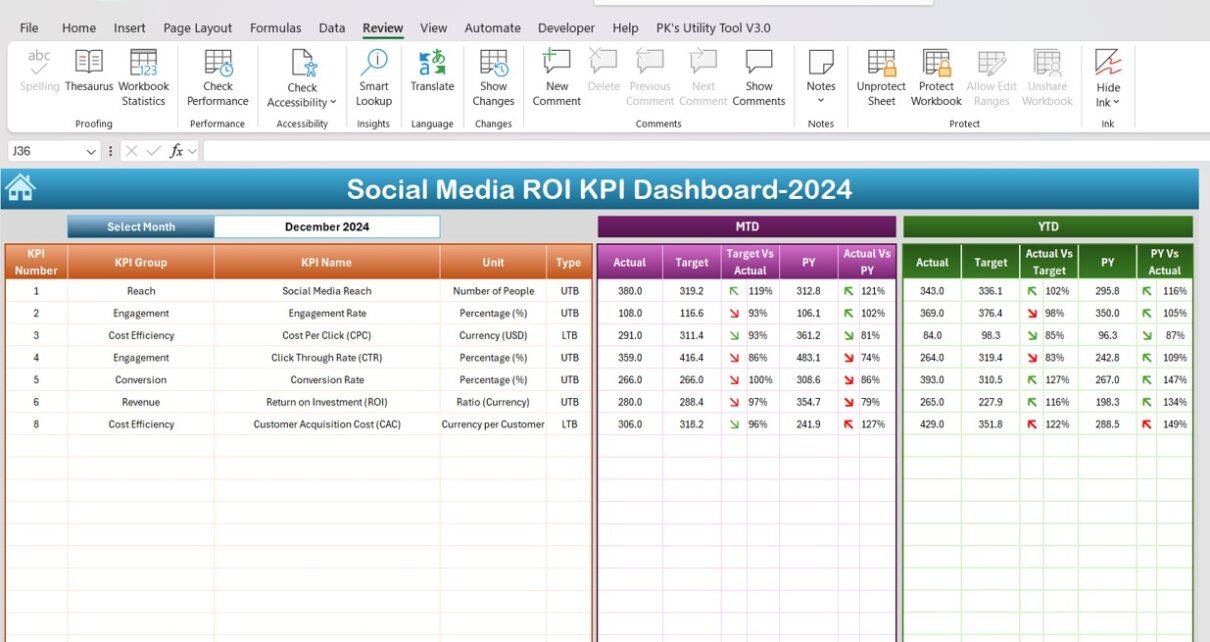
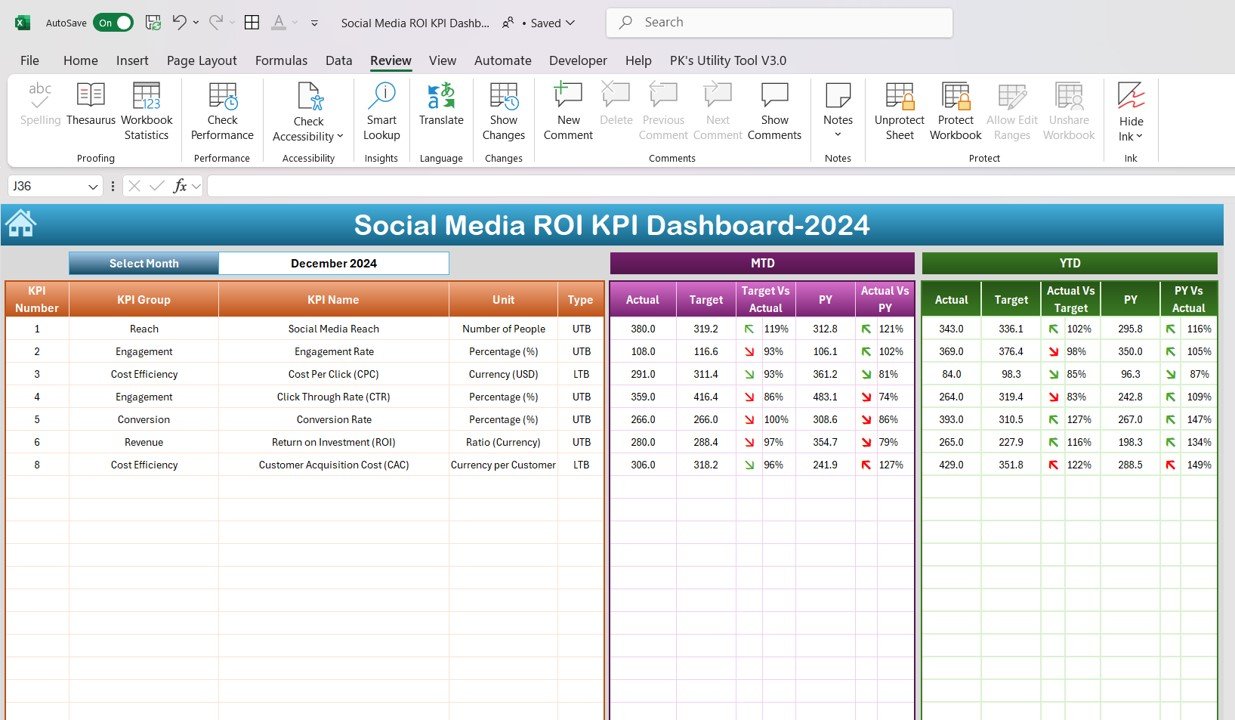
Dashboard Sheet Tab:
Displays all key social media KPIs. With a dropdown menu (Range D3), users can select the month, and the dashboard will update the data for that month, showing both MTD and YTD performance, target comparisons, and previous year data.
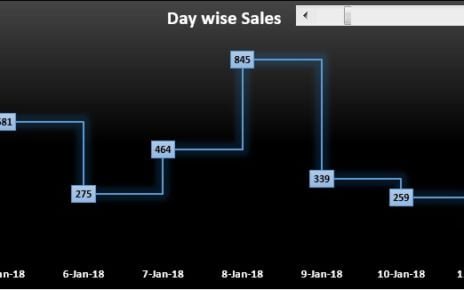
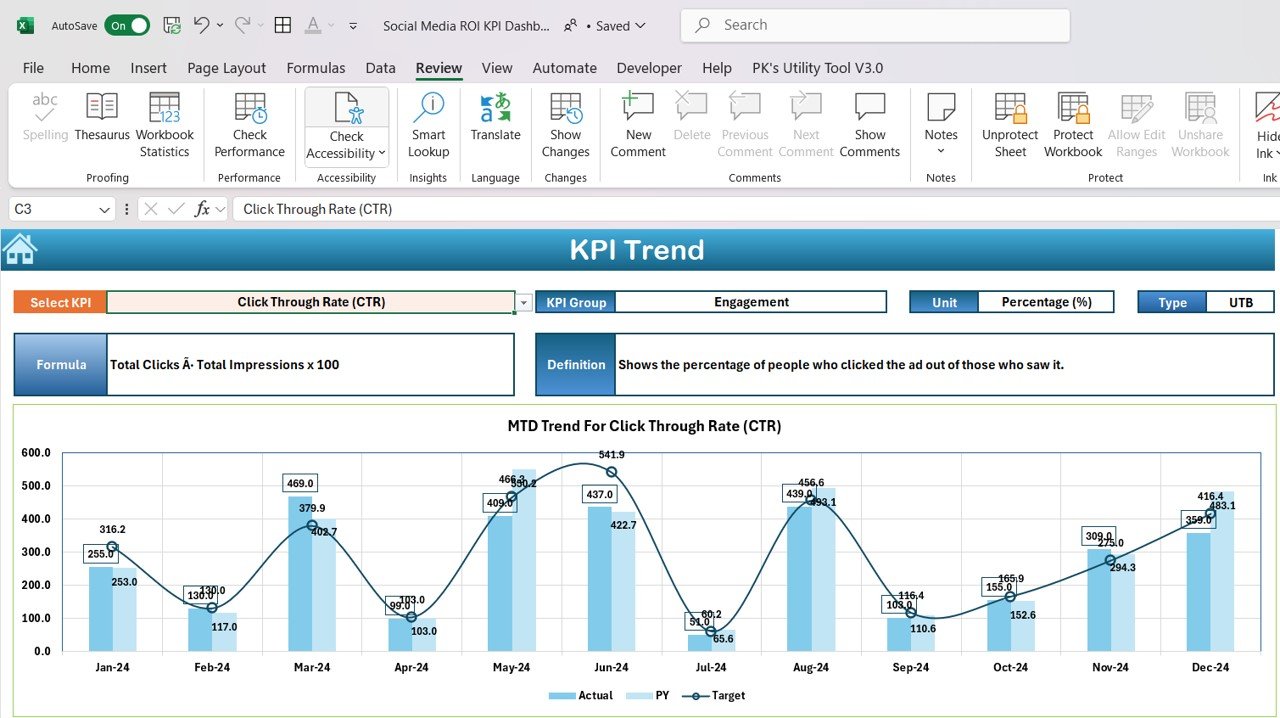
KPI Trend Sheet Tab:
Allows users to select a KPI from the dropdown (Range C3). Displays the KPI group, unit of measurement, formula, type (whether “lower the better” or “upper the better”), and a detailed definition of each KPI.
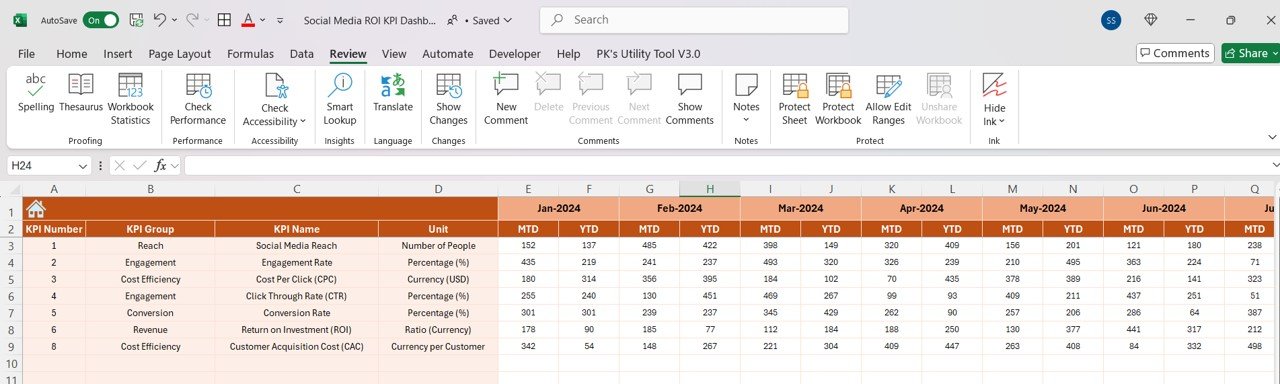
Actual Numbers Sheet Tab:
Users can enter actual MTD and YTD data for social media metrics. The dashboard is flexible, allowing for easy updates and month-to-month tracking.
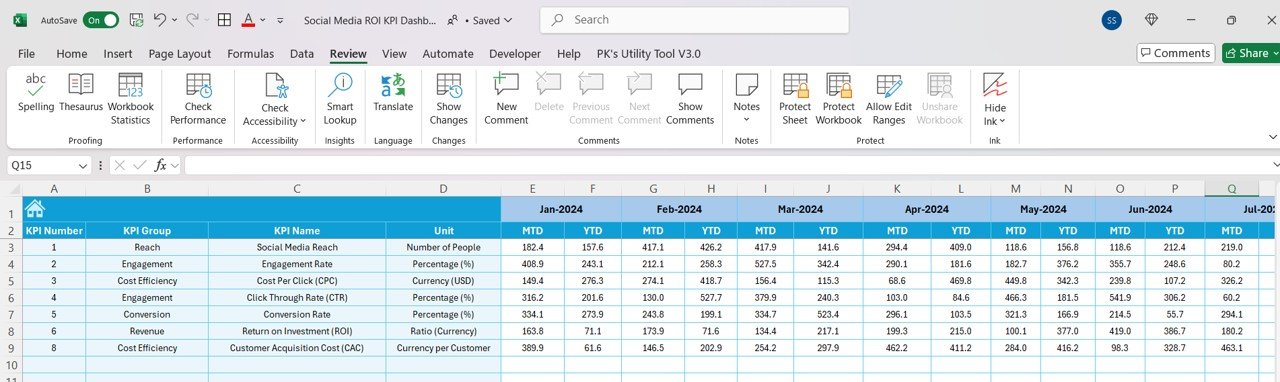
Target Sheet Tab:
Helps businesses input target numbers for each KPI for both MTD and YTD to measure actual performance against goals.
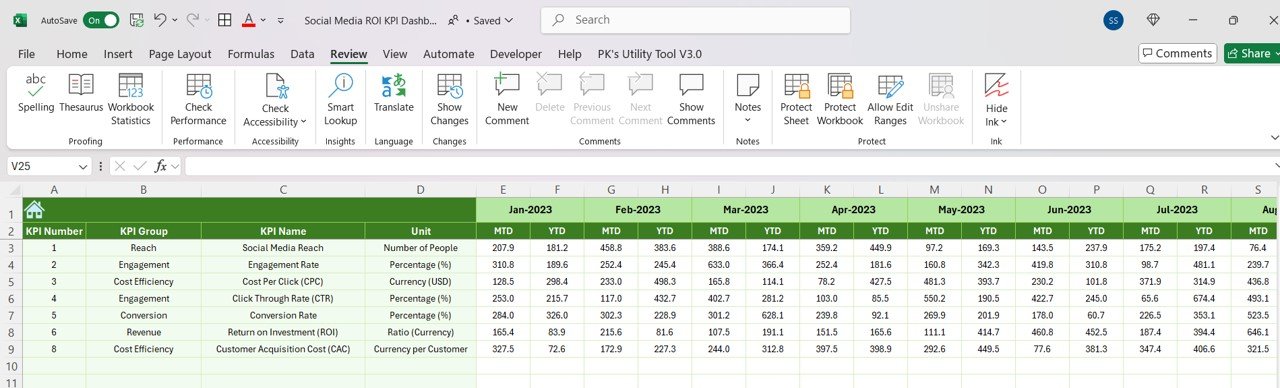
Previous Year Numbers Sheet Tab:
Compares the current year’s social media performance with previous year data, giving valuable insights into progress.
KPI Definition Sheet Tab:
Allows users to define each KPI, including name, unit, formula, and detailed explanation for clarity and ease of use.