The Social Services KPI Dashboard in Excel is a comprehensive, ready-to-use template designed to help social service organizations track and manage their key performance indicators (KPIs) effectively. This user-friendly dashboard provides an insightful view of critical metrics, empowering organizations to make data-driven decisions that enhance their impact and efficiency.
Key Features:
Home Sheet
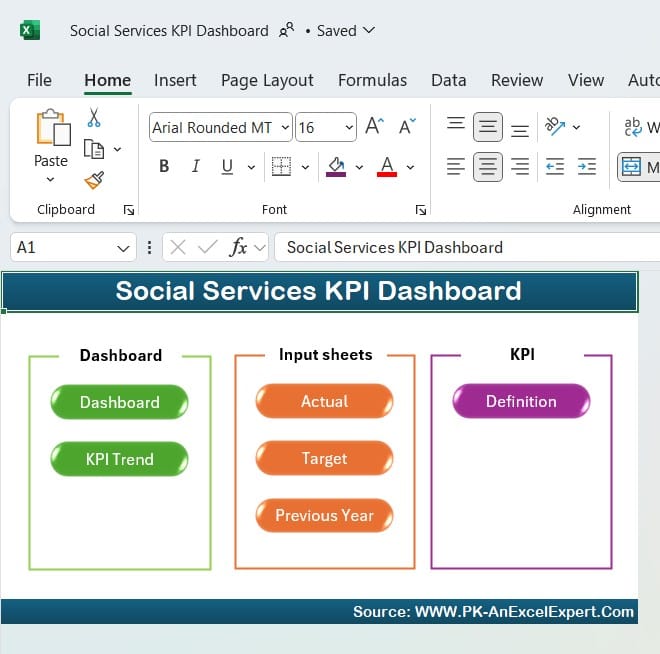
The Home Sheet serves as an index with six navigation buttons, enabling quick access to all sections of the dashboard.
Dashboard Sheet Tab
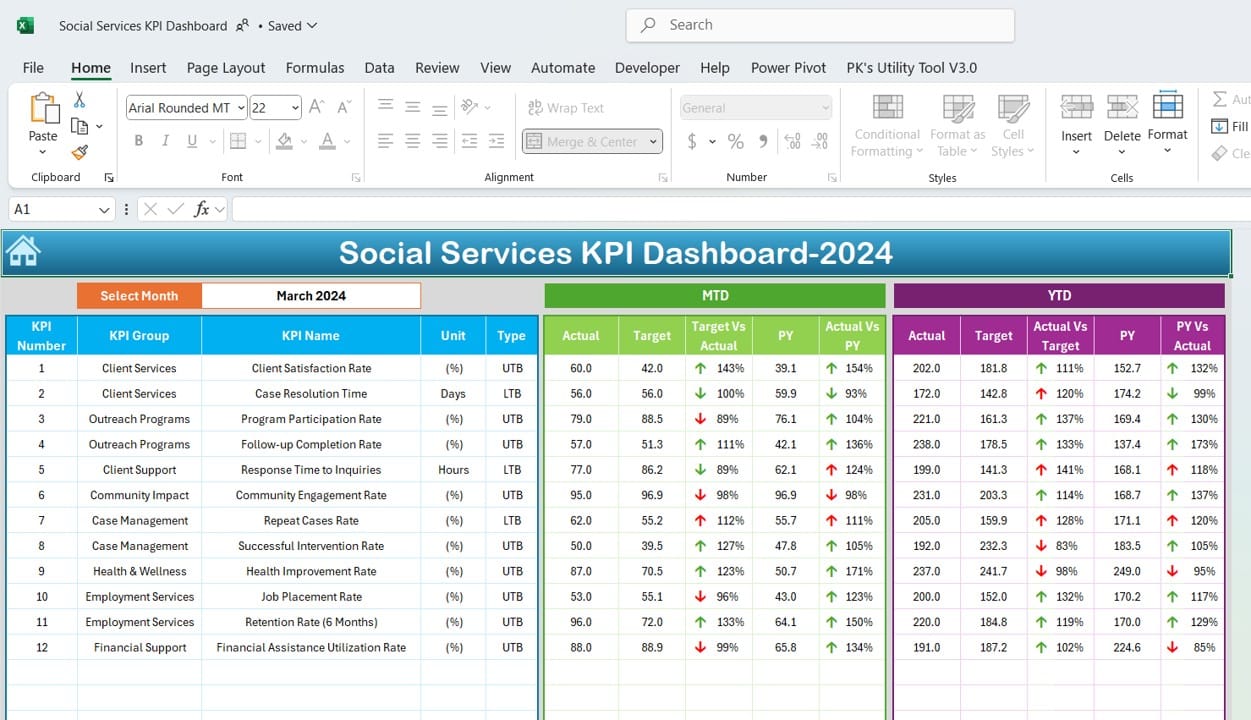
The main dashboard tab provides a dynamic overview of all KPIs, updating automatically based on the selected month. It displays Month-to-Date (MTD) and Year-to-Date (YTD) Actuals, Targets, and Previous Year (PY) data, complete with trend indicators through conditional formatting.
KPI Trend Sheet Tab
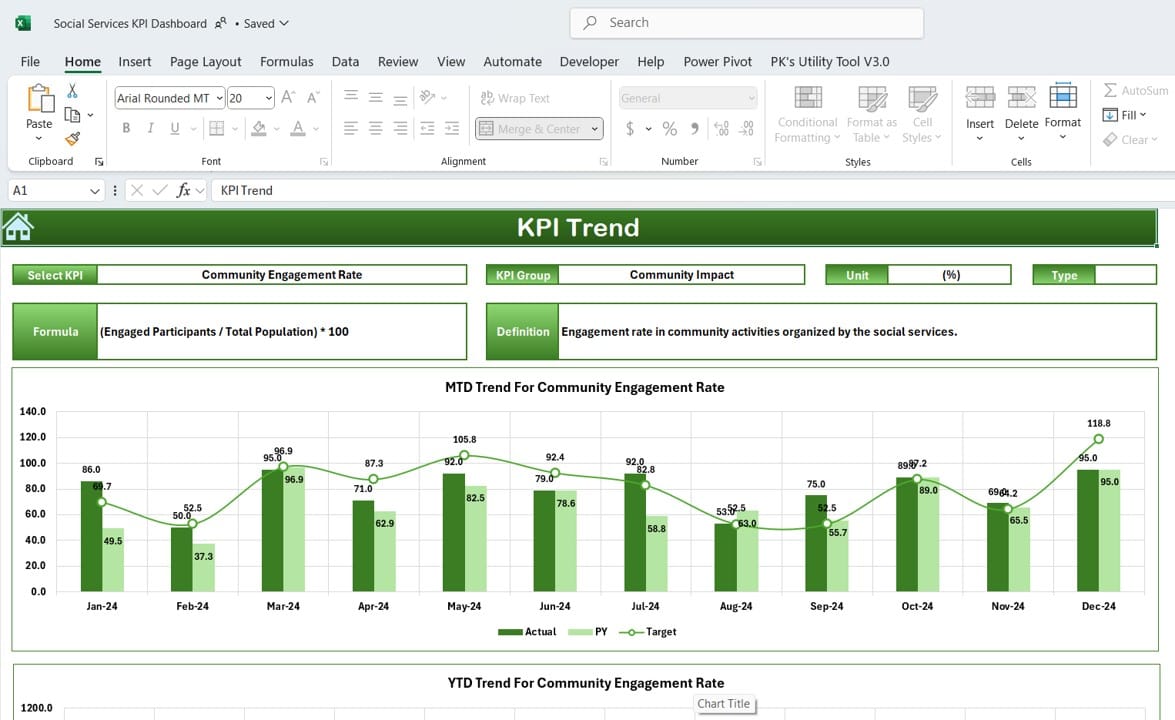
This sheet allows users to select a specific KPI and view detailed information, including KPI Group, Unit, Type (whether higher or lower values are better), Formula, and Definition. MTD and YTD trend charts for Actual, Target, and PY data provide a visual representation of performance.
Actual Numbers Input Sheet
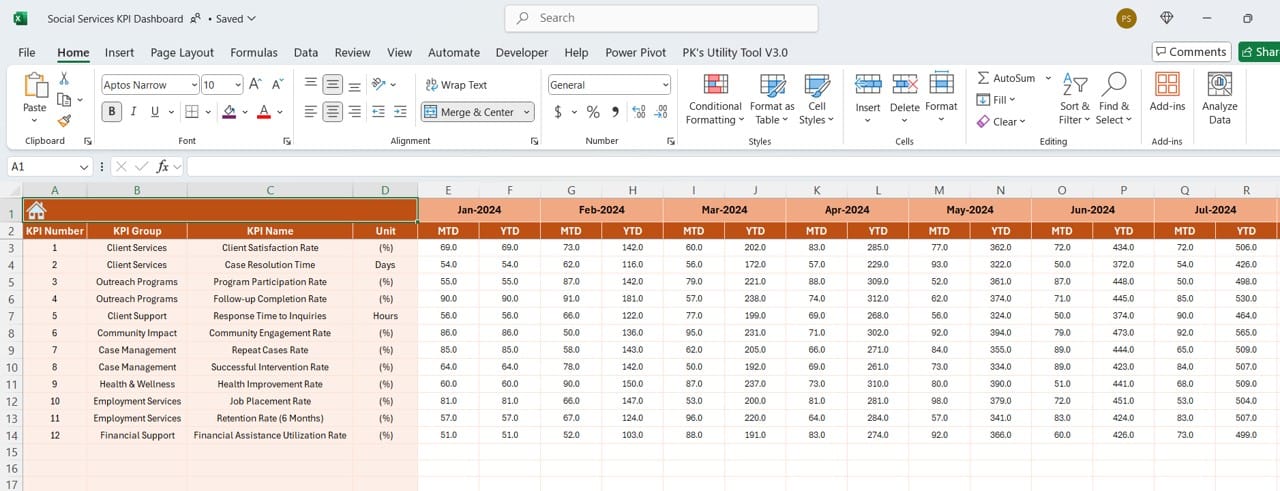
This tab is for entering monthly and yearly actual figures. Users can set the month by adjusting cell E1, allowing consistent tracking from the start of the year.
Target Sheet Tab
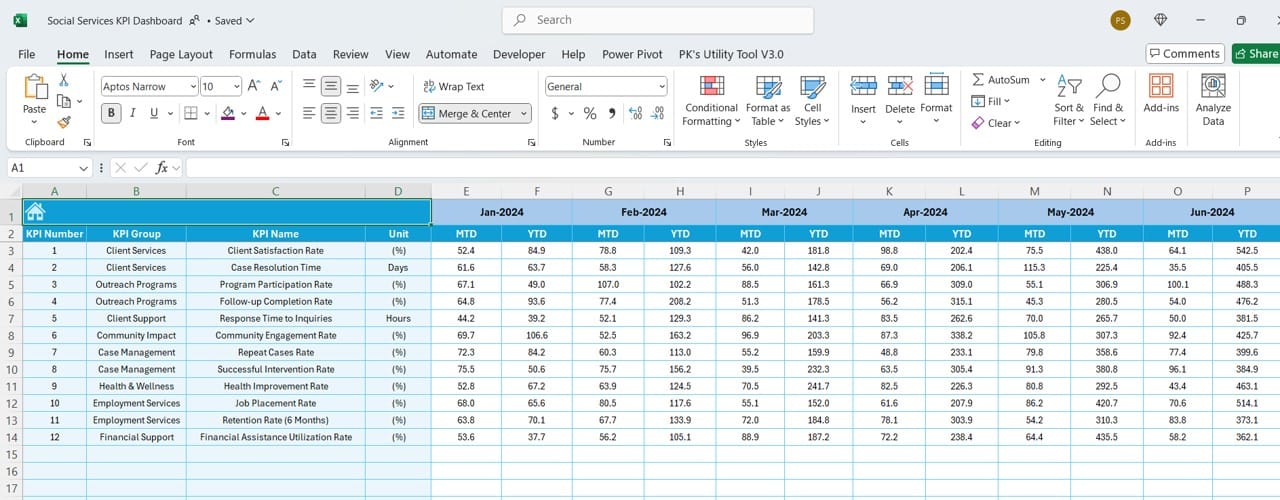
Input MTD and YTD target numbers for each KPI, providing clear goals to strive toward.
Previous Year Number Sheet Tab
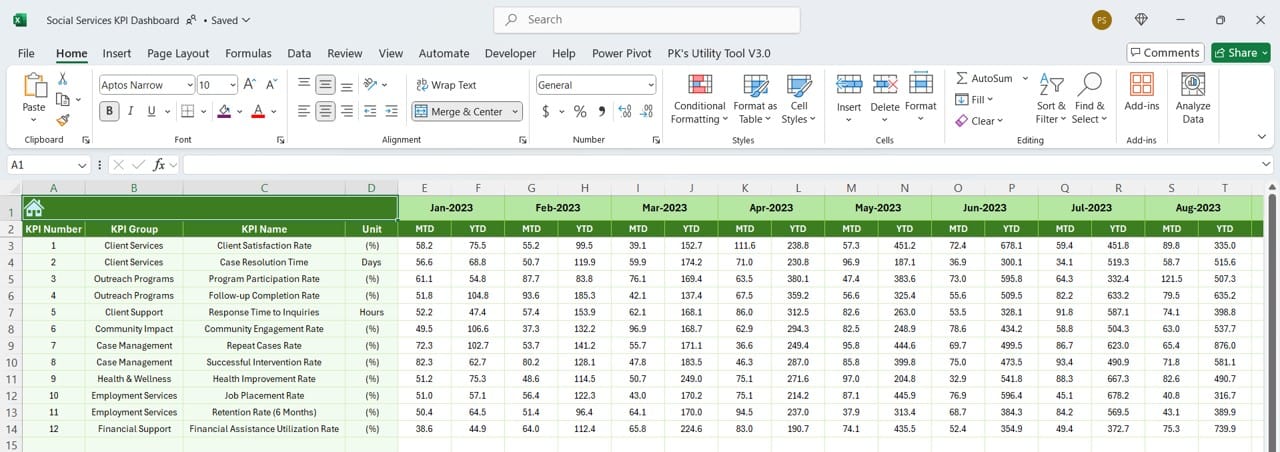
This sheet is for entering data from the previous year, facilitating easy performance comparison.
KPI Definition Sheet Tab
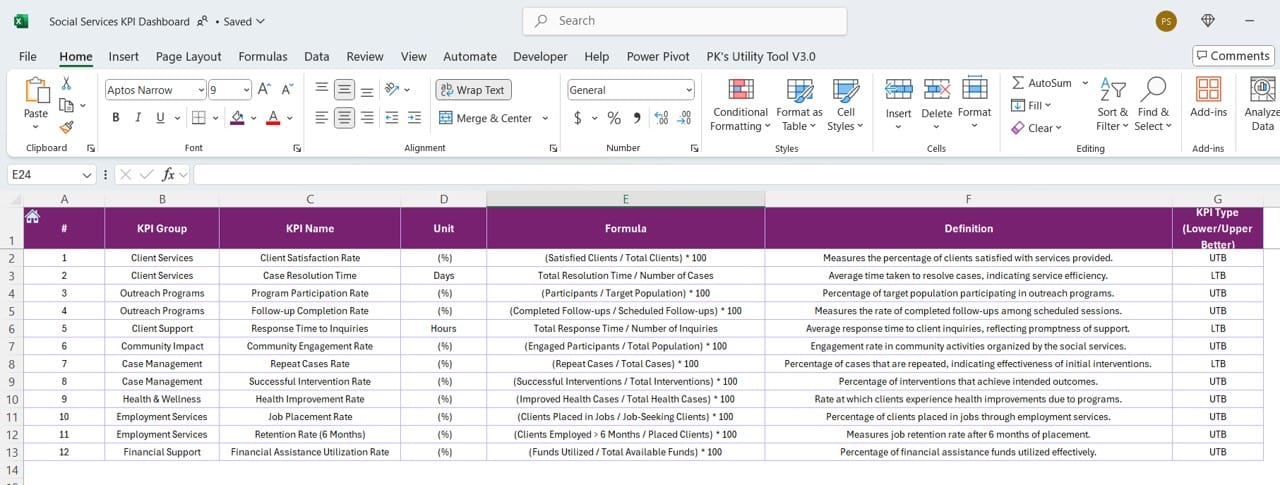
The KPI Definition Sheet captures essential details for each KPI, such as Name, Group, Unit, Formula, and Definition, ensuring clarity and understanding for all users.
Read the detailed blog post