In the world of sponsorship, tracking performance is key to maximizing returns and ensuring mutually beneficial partnerships. Whether you are a business looking to engage with sponsors or a brand seeking sponsorship opportunities, understanding the effectiveness of sponsorship activities is critical
Key Features of the Sponsorship KPI Dashboard
The Sponsorship KPI Dashboard template includes seven worksheets, each with its unique purpose to facilitate effective tracking and reporting of sponsorship activities:
Home Sheet:
The central hub of the dashboard, where users can navigate to different sections. This sheet includes six buttons that allow users to jump to specific worksheets, making it easy to access and manage data.

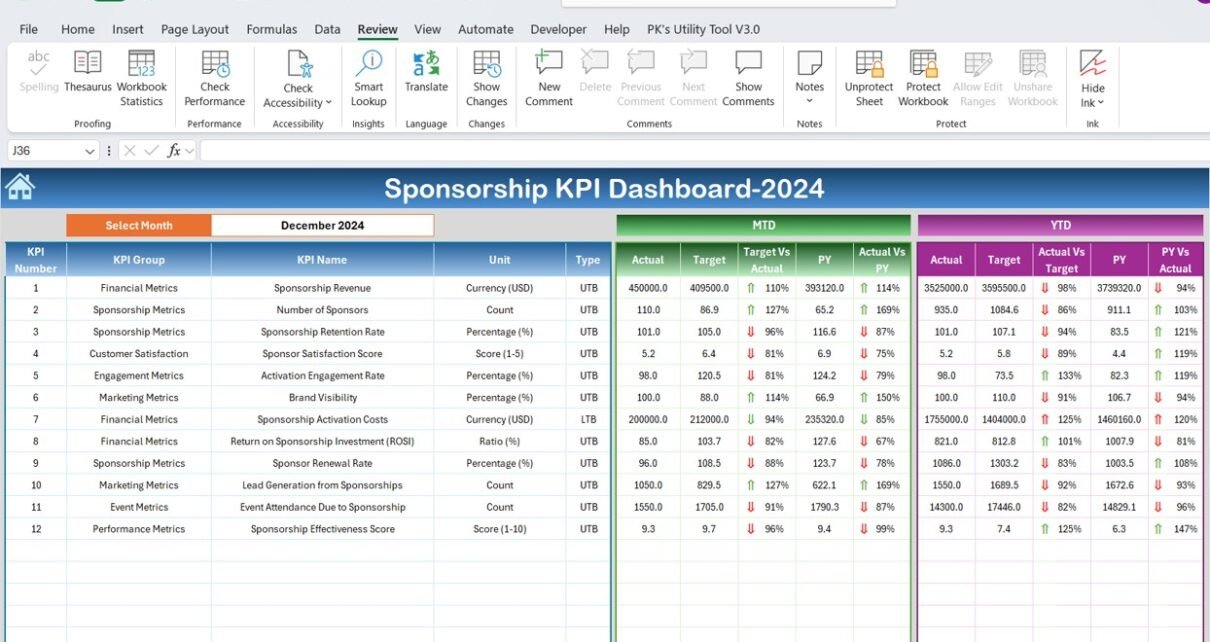
Dashboard Sheet Tab:
This is the main sheet that displays all KPIs in a visual format. Users can select the month from a drop-down list (Range D3), and the entire dashboard will update with the selected month’s data. It shows:
- MTD (Month-to-Date) Actual vs. Target performance
- YTD (Year-to-Date) Actual vs. Target performance
- Target vs. Actual comparison with conditional formatting arrows indicating whether performance is improving or declining
- Previous Year (PY) comparison to assess year-over-year performance

KPI Trend Sheet Tab:
This sheet provides detailed information about each selected KPI, including:
- KPI Group
- Unit of Measurement
- KPI Type (whether “Lower the Better” or “Upper the Better”)
- Formula for calculating the KPI
- KPI Definition

Actual Numbers Sheet Tab:
This sheet is where users enter the actual data for both YTD and MTD. The data will update automatically based on the month selected in Range E1, providing flexibility for businesses to enter data on a monthly basis.

Target Sheet Tab:
This section allows users to enter the target values for each KPI for both MTD and YTD. This feature helps businesses compare actual performance against set goals, allowing them to monitor progress effectively.

Previous Year Numbers Sheet Tab:
In this sheet, users can input the corresponding data from the previous year, enabling year-over-year comparisons to evaluate progress and identify trends.

KPI Definition Sheet Tab:
This sheet includes the name, group, unit, formula, and definition of each KPI, providing users with a comprehensive understanding of the KPIs and how they are calculated.