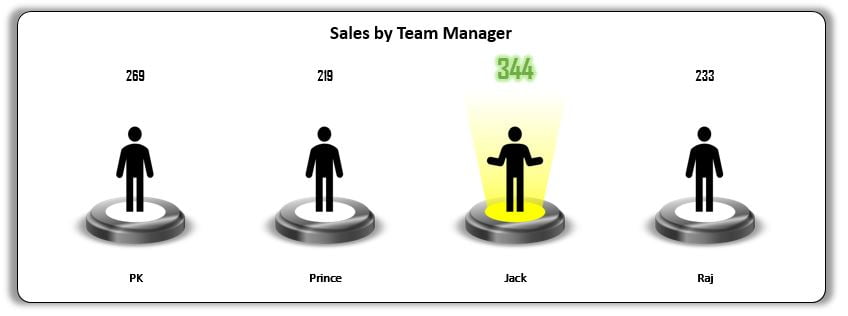
Elevate your reporting with “Spotlight Visualization in Excel (Part-2),” where we focus on accentuating top performers in data charts. This segment builds on the foundational techniques from Part-1 and introduces spotlight effects in column charts to showcase leading team managers by sales. Tailored for data-driven decision-making, this tool is ideal for visually identifying and highlighting key contributors in your team.
Key Features of Spotlight Visualization in Excel (Part-2):
- Top Performer Highlight: Automatically highlights the team manager with the highest sales in the column chart, making it easy to recognize outstanding performance at a glance.
- Dual Variant Visuals: Offers two distinct visualization variants, allowing users to select the style that best fits their presentation needs or preferences.
- Customizable and Interactive: Both chart variants are fully customizable, providing flexibility to modify the spotlight features according to specific data sets or reporting standards.