The Startup Growth KPI Dashboard in Power BI is a ready-to-use, data-driven solution designed to help startups track their key performance indicators (KPIs) efficiently. This dashboard provides a real-time view of business performance by integrating Excel-based data into a visually interactive Power BI report. With dynamic slicers, trend analysis, and detailed KPI tracking, startups can make informed decisions to drive growth.
Key Features
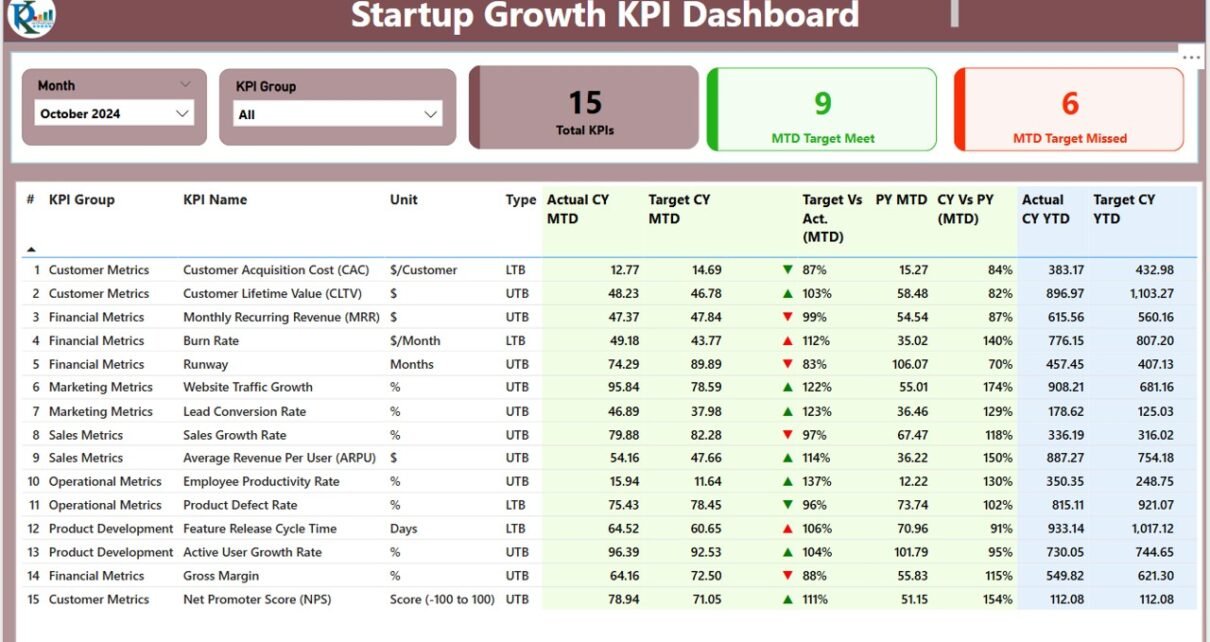
Summary Page
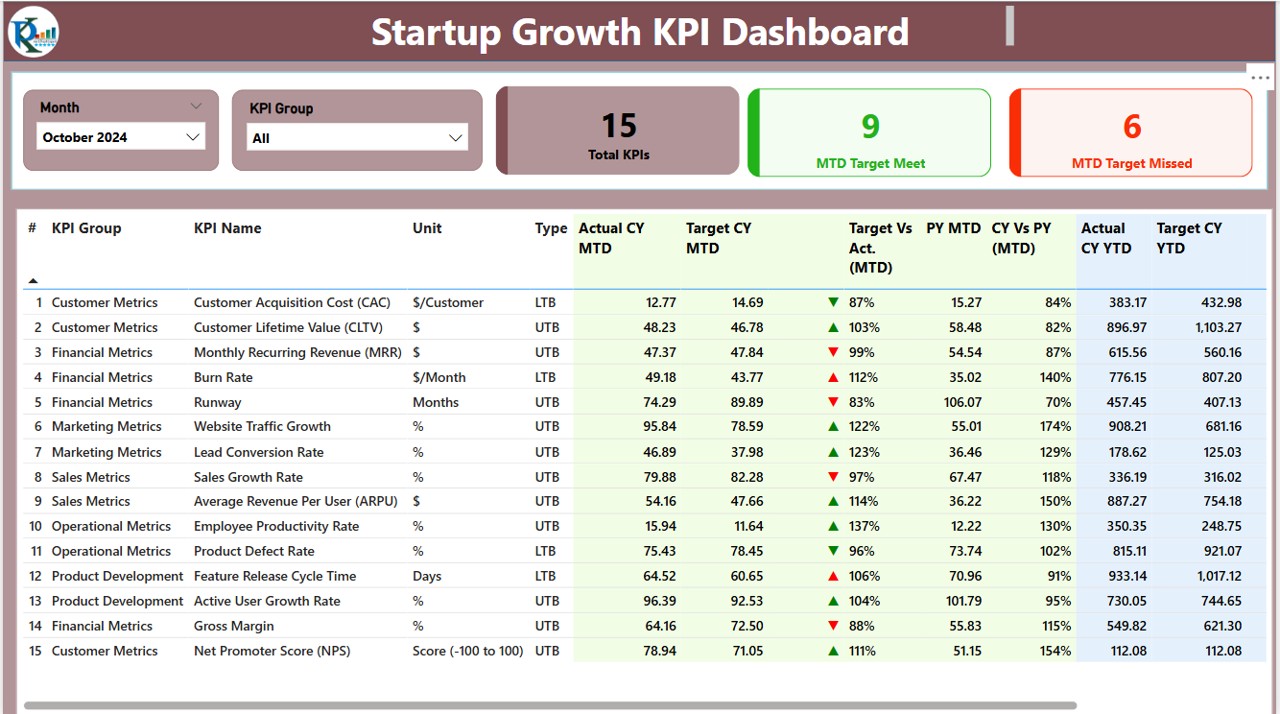
A comprehensive overview with slicers, KPI cards, and a detailed KPI table showing MTD and YTD comparisons.
KPI Trend Page
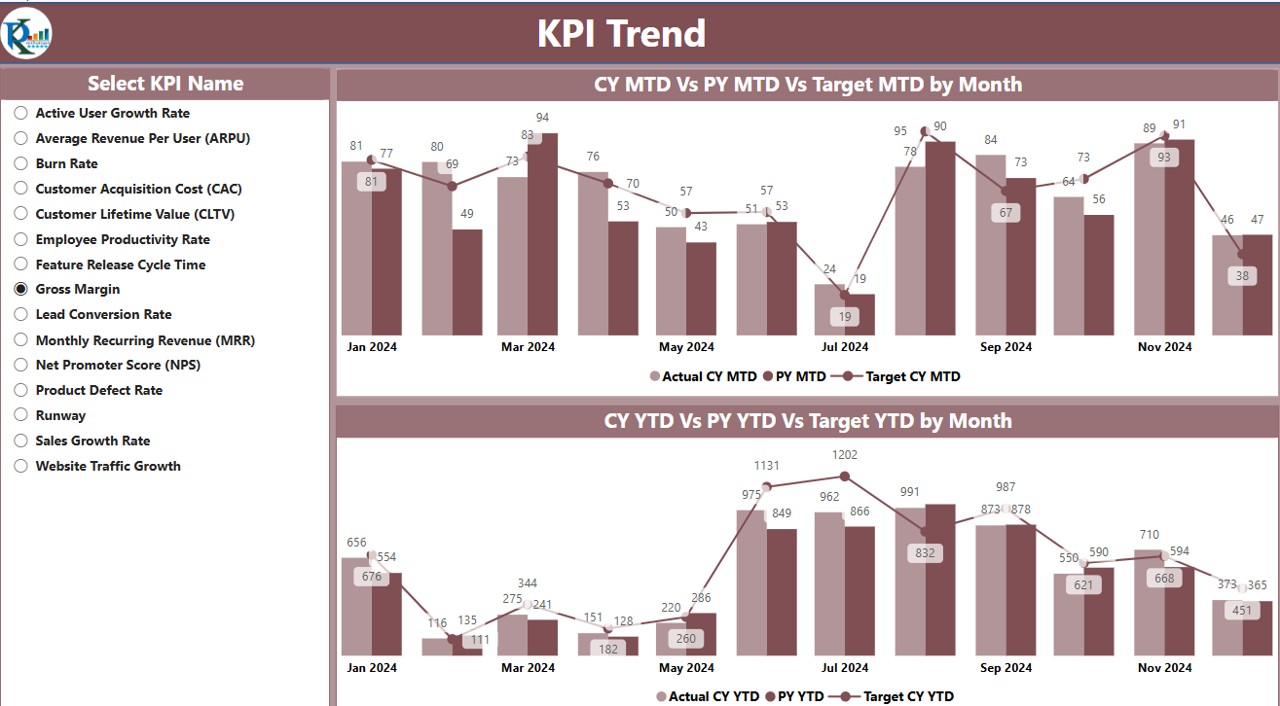
Interactive combo charts displaying actual vs. target metrics for MTD and YTD values, with KPI selection filters.
KPI Definition Page
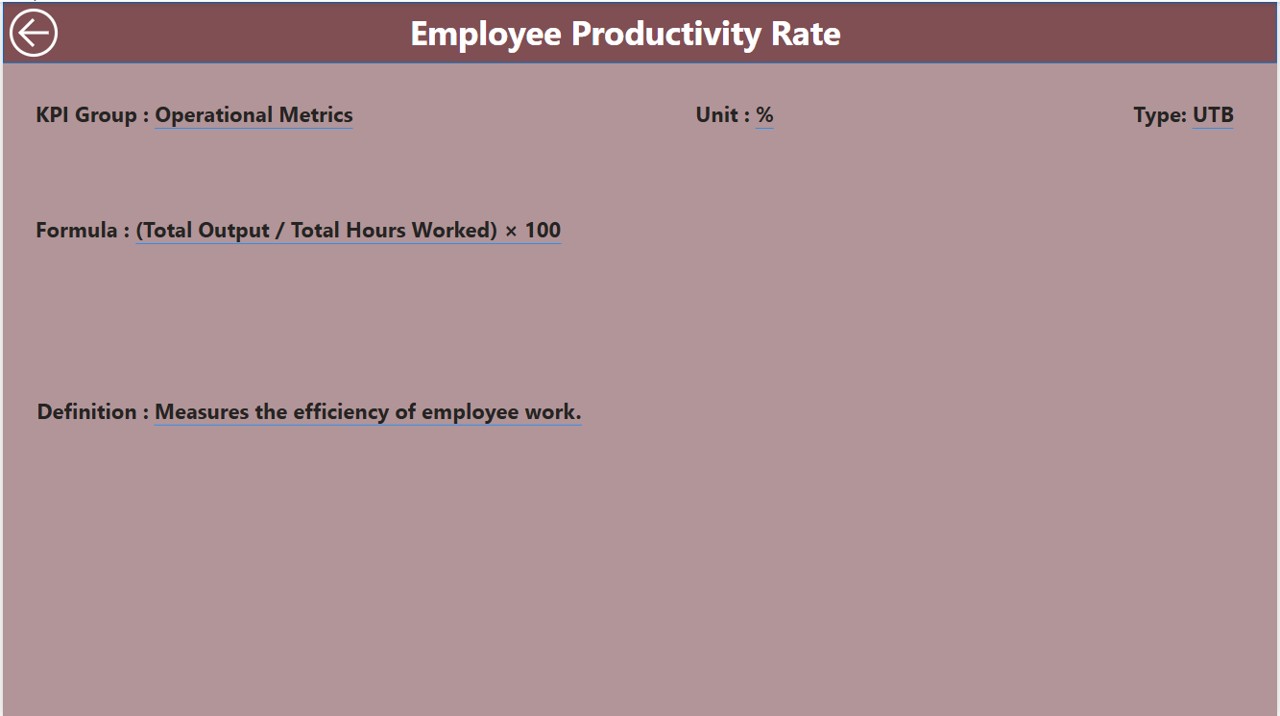
A drill-through page providing KPI formulas and definitions for deeper insights.
Excel Integration
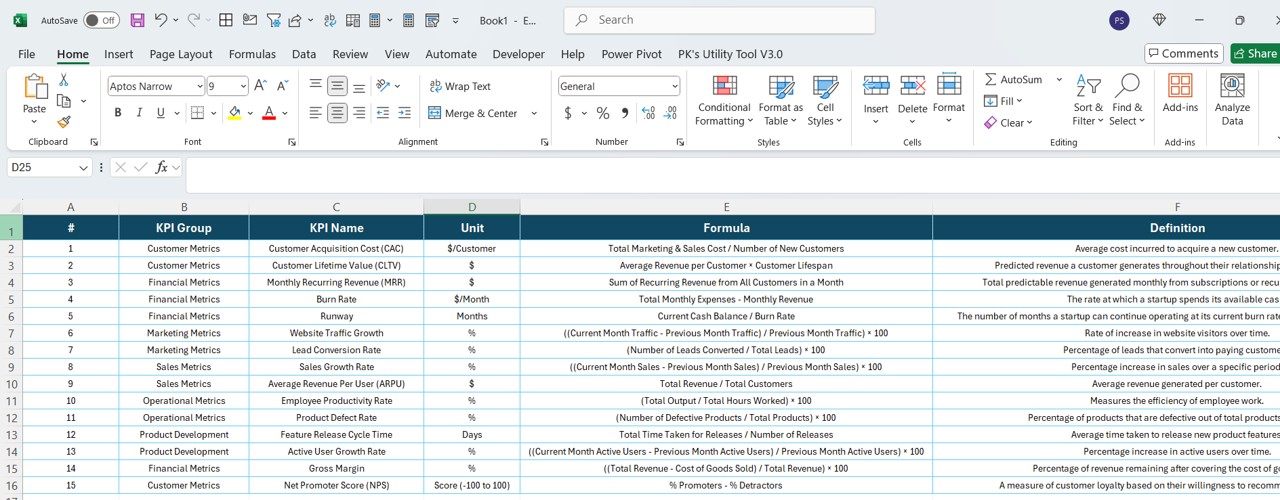
Easy-to-update Excel sheets for Actuals, Targets, and KPI Definitions, ensuring seamless data management.
Performance Indicators
Visual alerts (▲▼ icons) indicating KPIs meeting or missing targets, helping businesses track progress effectively.
User-Friendly Navigation
Intuitive design with a back button for smooth navigation between dashboard pages.