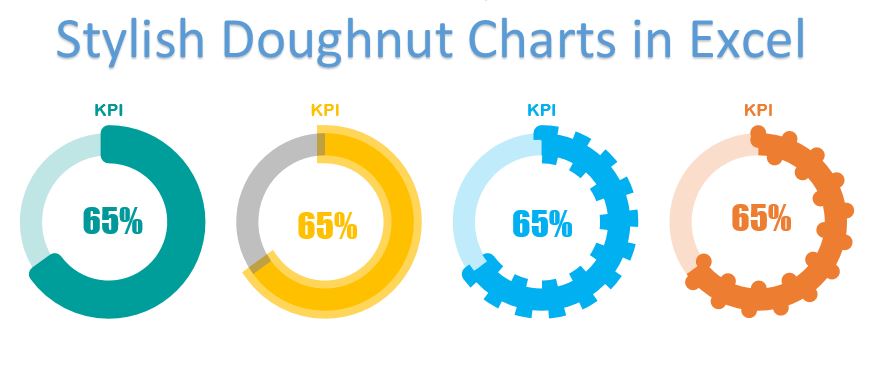
Elevate your business dashboards and presentations with our comprehensive guide on creating stylish doughnut charts in Excel. This tutorial will teach you how to design four unique doughnut charts that are perfect for displaying KPI metrics or tracking project progress. Whether for business analysis or visual reporting, these charts will add a sophisticated touch to your data presentations.
Key Features:
- Four Unique Designs: Learn to create a series of visually appealing doughnut charts, each tailored to represent different data sets effectively.
- Dynamic Data Integration: Instructions on linking your charts directly to Excel cells, ensuring that any data updates are immediately reflected in the visual display.
- Customizable Aesthetics: Detailed guidance on customizing colors, borders, and transparency to match your corporate style or presentation theme.
Read the detailed blog post