In the ever-evolving world of cybersecurity, businesses need effective tools to monitor and enhance their security infrastructure. The System Security KPI Dashboard in Excel is a comprehensive solution designed to help organizations track their security performance, analyze potential risks, and optimize their security processes in real time.
Key Features of the System Security KPI Dashboard in Excel
The System Security KPI Dashboard is a ready-to-use template that streamlines the process of security monitoring. With 7 essential worksheets, it provides all the functionality necessary for tracking security performance and making data-driven decisions:
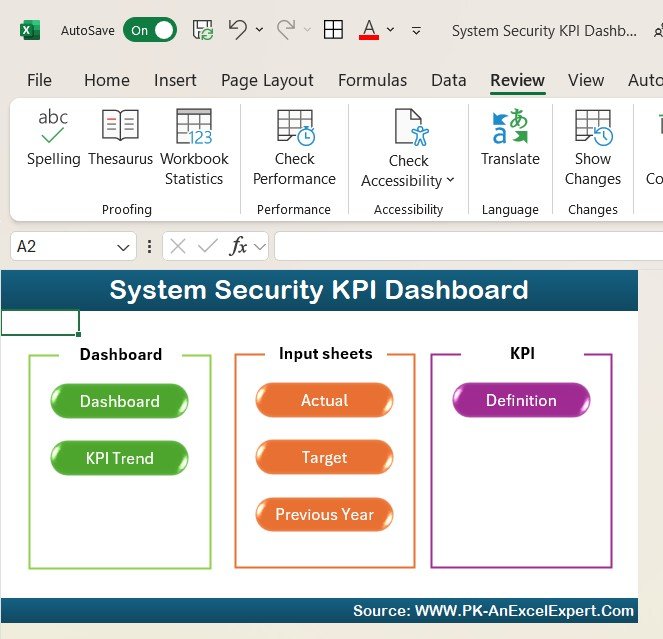
Home Sheet
- Purpose: Acts as an index with quick access buttons to all other sheets, making navigation seamless.
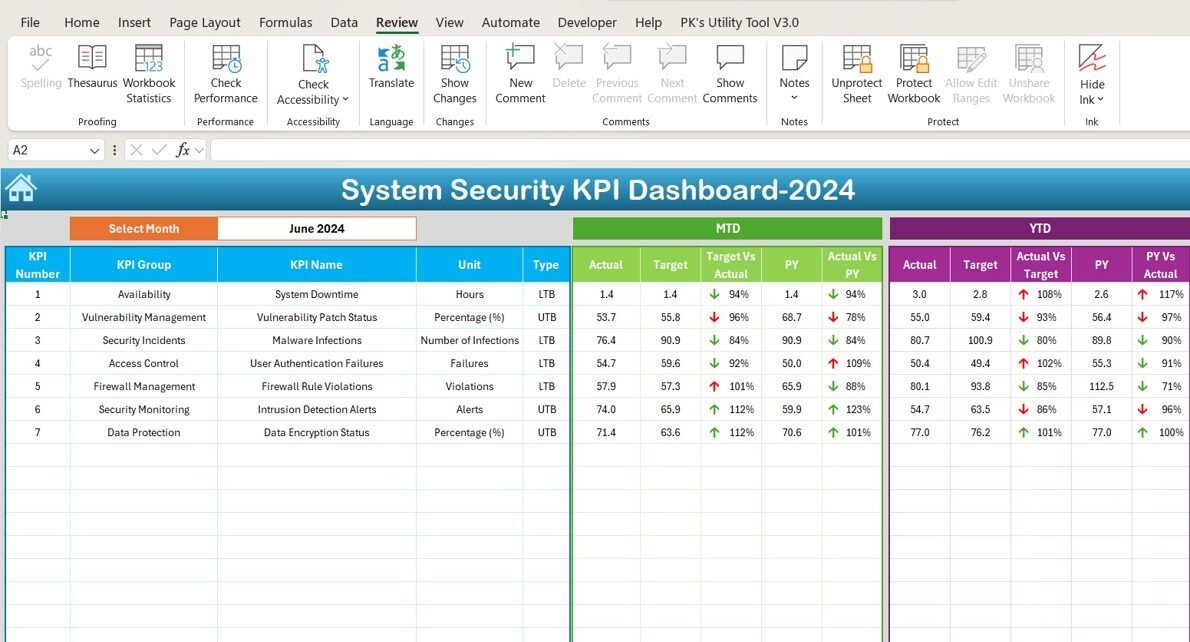
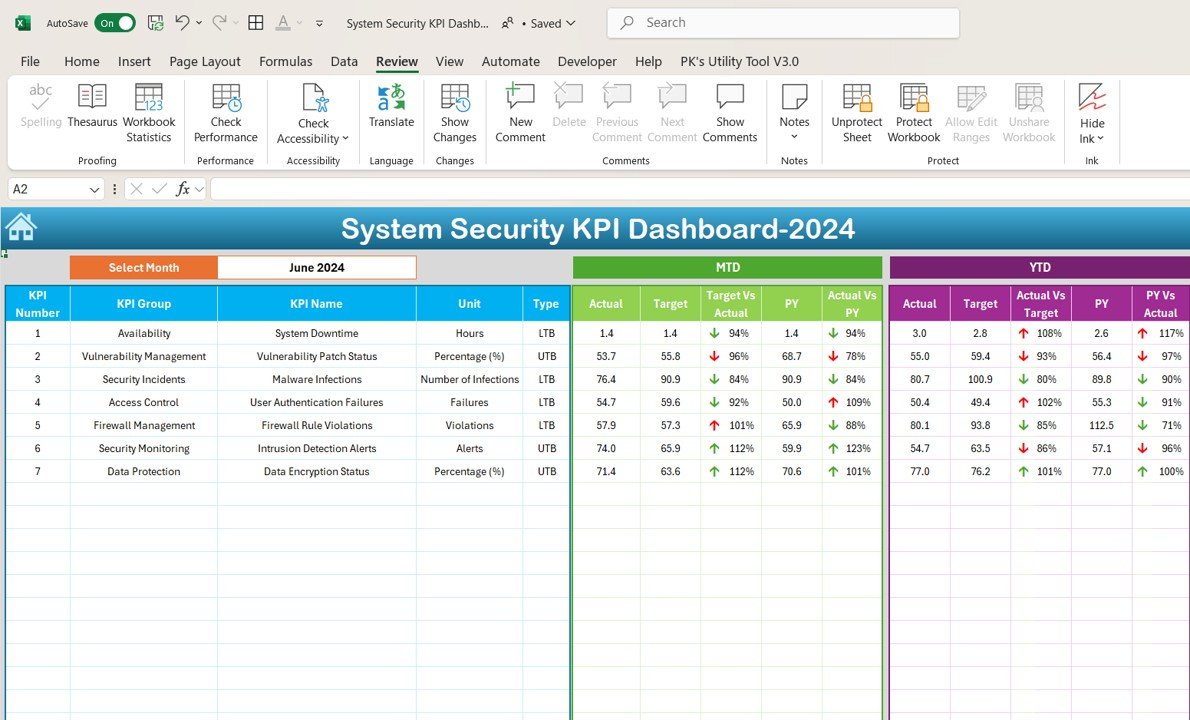
Dashboard Sheet Tab
- Purpose: The main sheet, displaying all key security KPIs. Users can select the month from a dropdown, and the data will automatically update to show MTD (Month-to-Date) and YTD (Year-to-Date) performance, as well as comparisons with targets and previous year data.
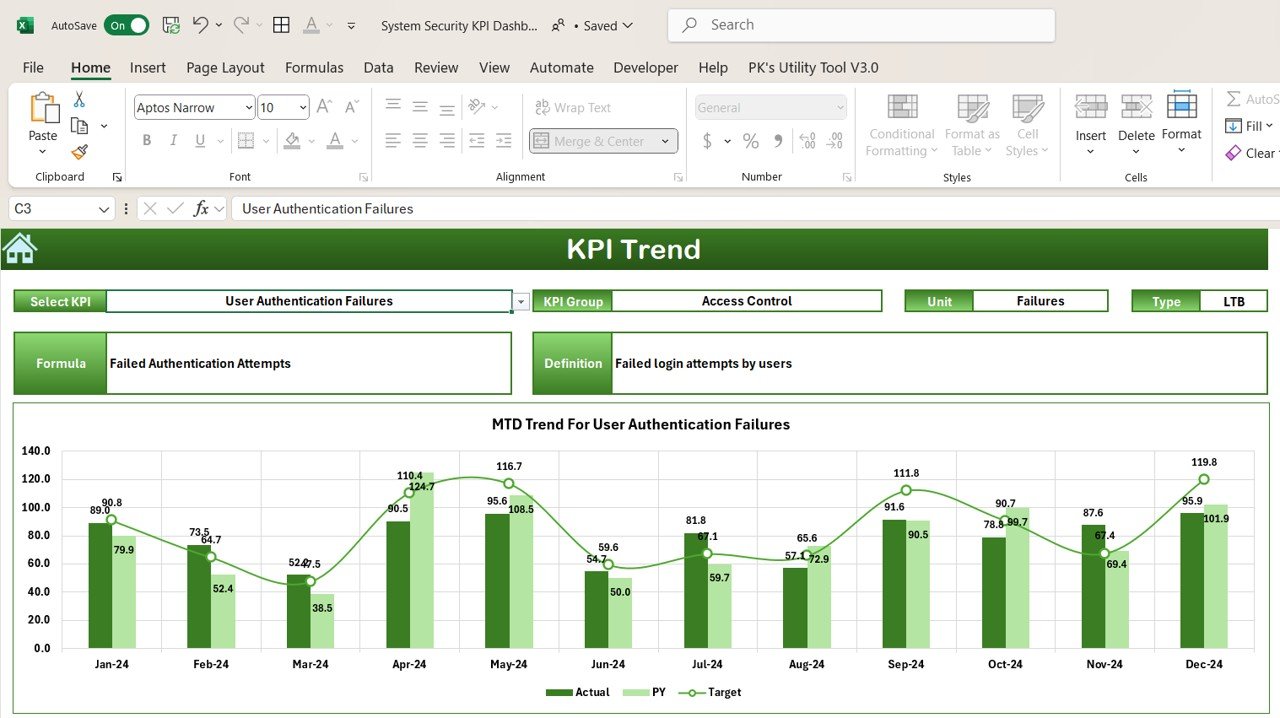
KPI Trend Sheet Tab
- Purpose: Allows users to select any KPI, where they can view details such as KPI group, unit, type (Lower the better or Upper the better), and its definition.
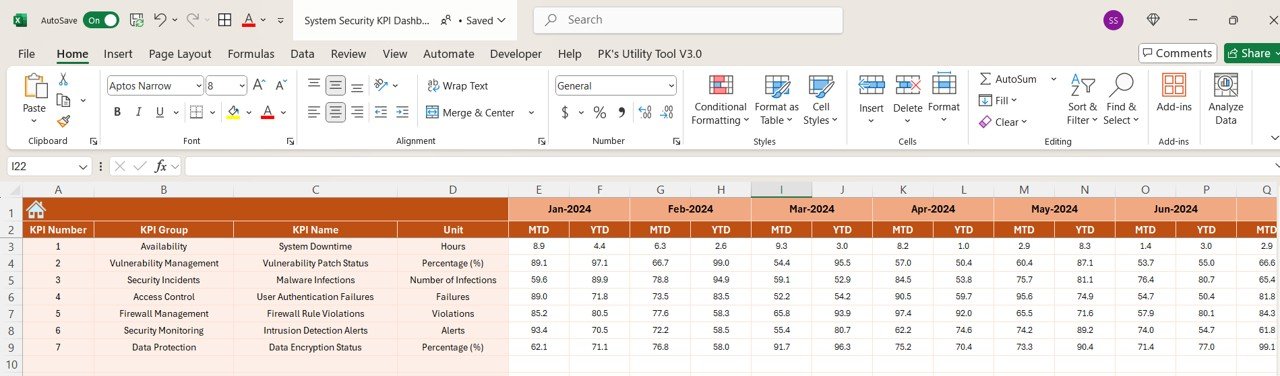
Actual Numbers Sheet Tab
- Purpose: A dynamic sheet that lets users input actual security data for both MTD and YTD, with the ability to select the month.
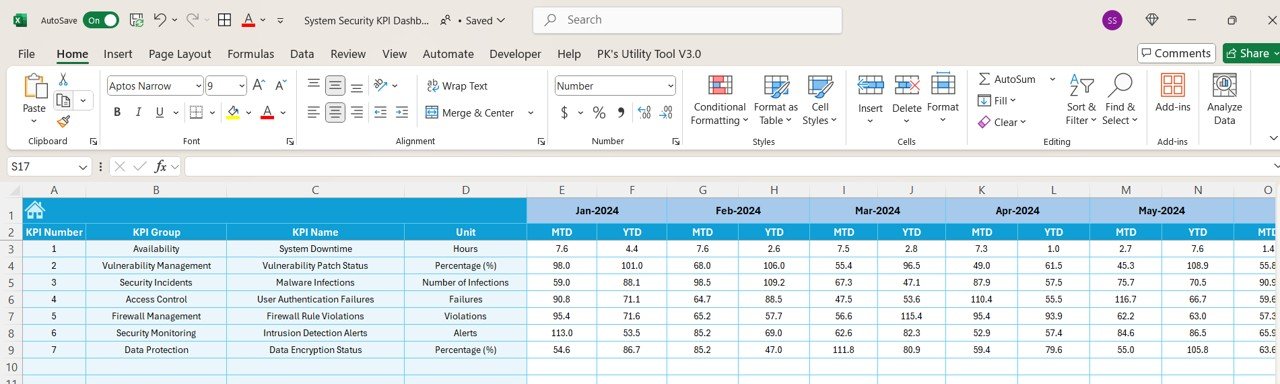
Target Sheet Tab
- Purpose: Users can input target values for each KPI, both MTD and YTD, to track their performance against the targets.
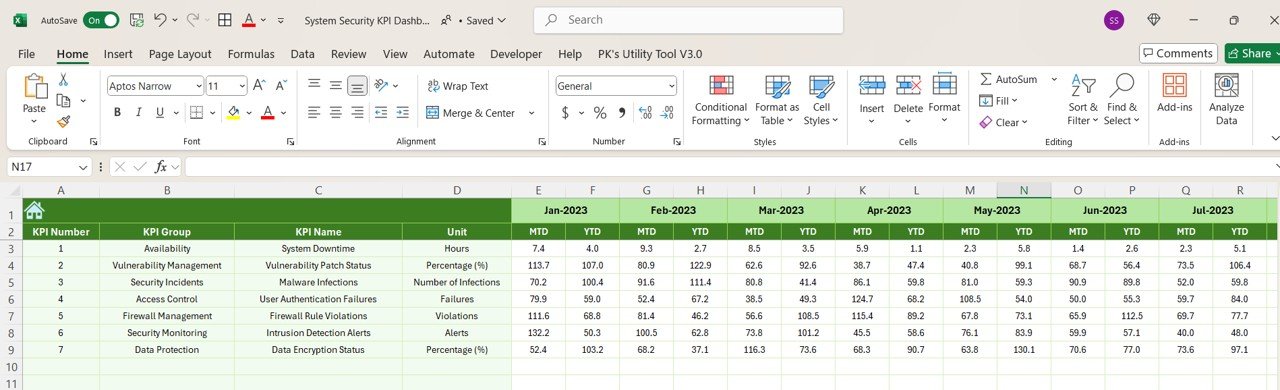
Previous Year Numbers Sheet Tab
- Purpose: This sheet is used to input data from the previous year to compare performance over time.
KPI Definition Sheet Tab
- Purpose: A comprehensive list of KPIs with their groups, units, formulas, and definitions to help users better understand each security metric.