In the competitive telecommunications industry, staying on top of key performance indicators (KPIs) is essential for improving operational efficiency and customer satisfaction. The Telecommunications KPI Dashboard in Power BI allows businesses to track performance in real-time, enabling them to make informed decisions based on data-driven insights. This powerful tool helps visualize and analyze critical metrics, ensuring that organizations align with their strategic goals.
Key Features of the Telecommunications KPI Dashboard in Power BI
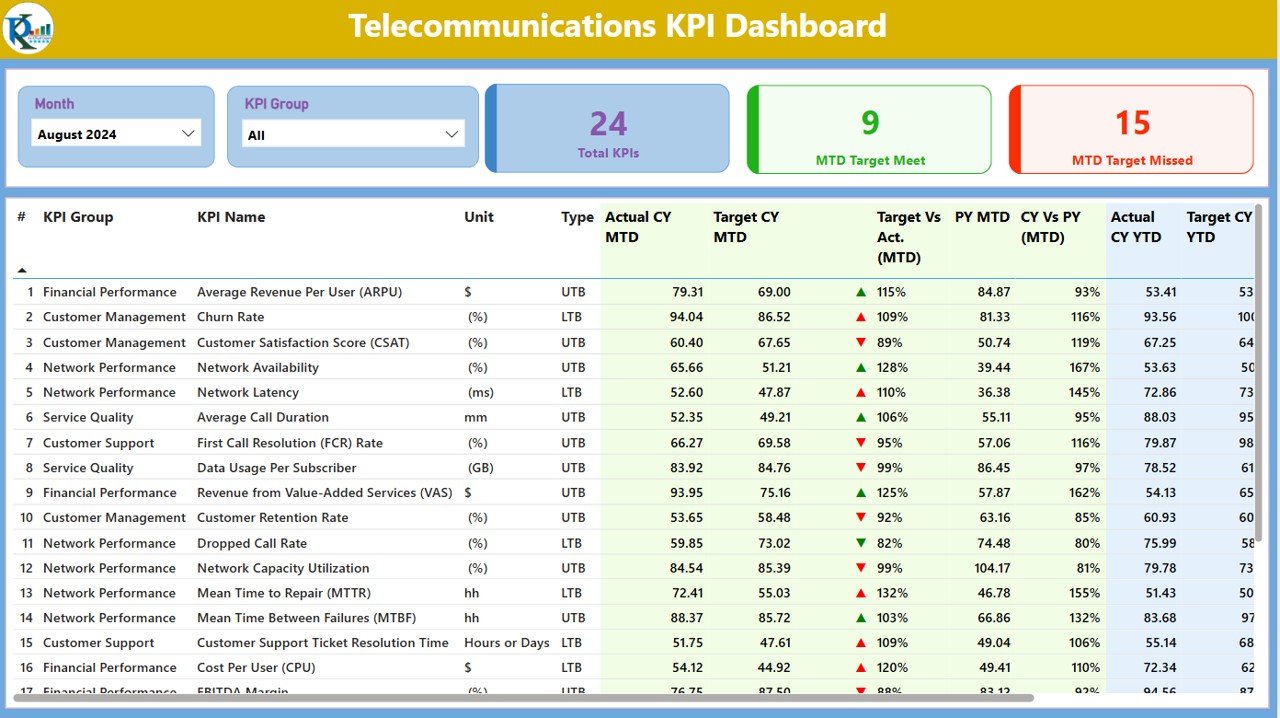
Summary Page:
Provides an overview of KPIs with slicers for easy customization. Displays detailed comparisons of actual vs. target values for MTD and YTD.
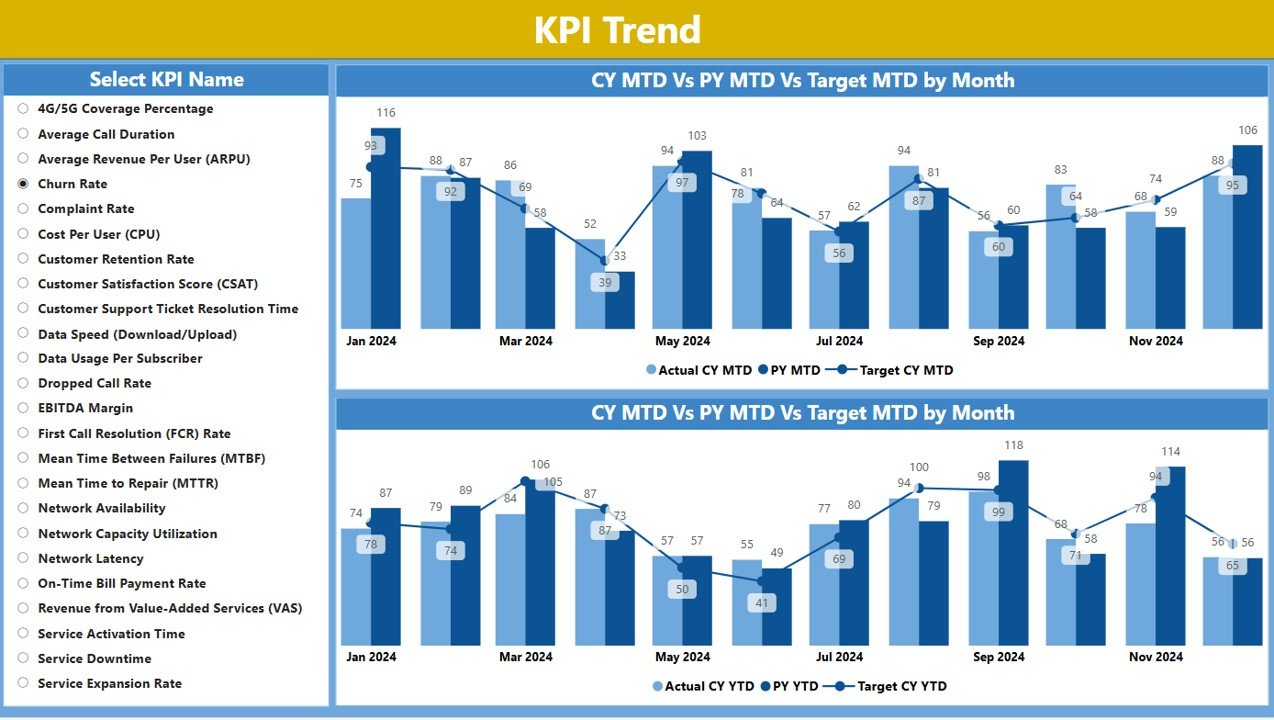
KPI Trend Page:
Visualizes trends using combo charts to compare current and previous year data. Allows tracking of KPI performance over time.
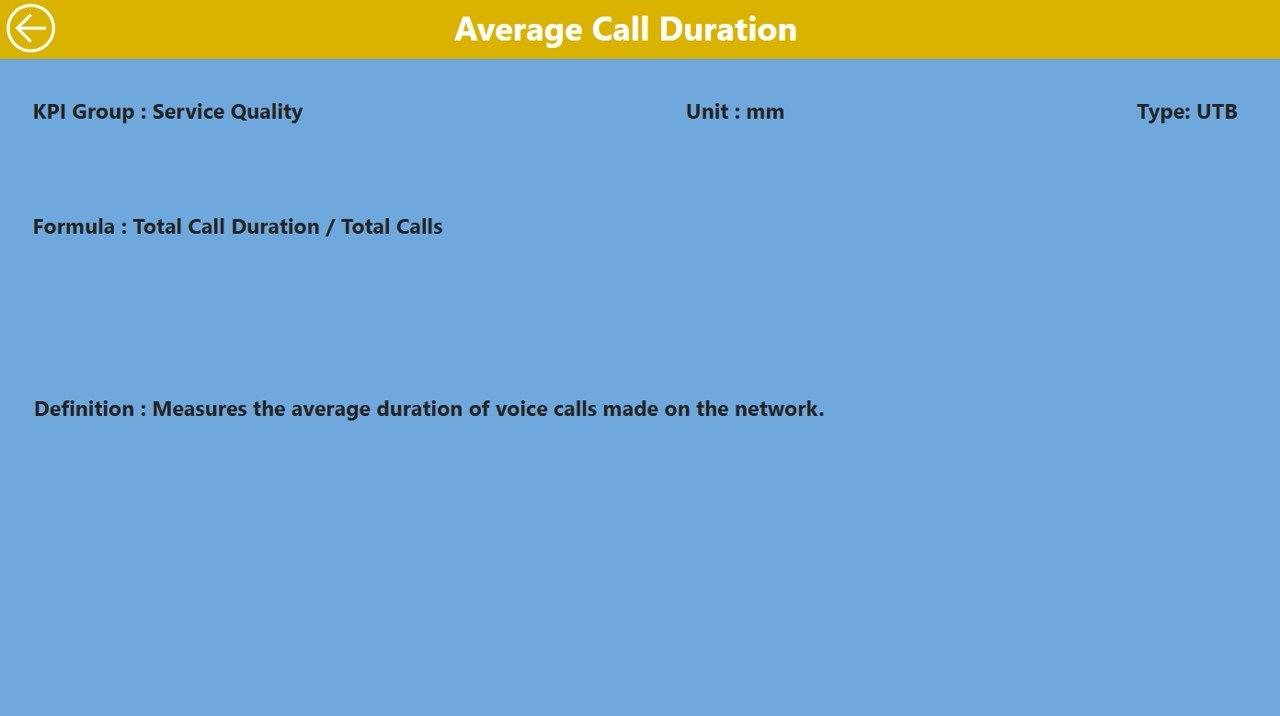
KPI Definition Page:
Offers in-depth KPI explanations, including formulas and definitions, allowing users to understand the logic behind each metric.