The Telehealth KPI Dashboard in Power BI is a ready-to-use, data-driven solution designed to help healthcare providers track and analyze telehealth performance metrics effectively. With real-time insights and interactive visualizations, this dashboard ensures data-driven decision-making to improve patient care, streamline operations, and optimize telehealth services.
Key Features of the Telehealth KPI Dashboard
Comprehensive Dashboard with Three Pages:
Summary Page
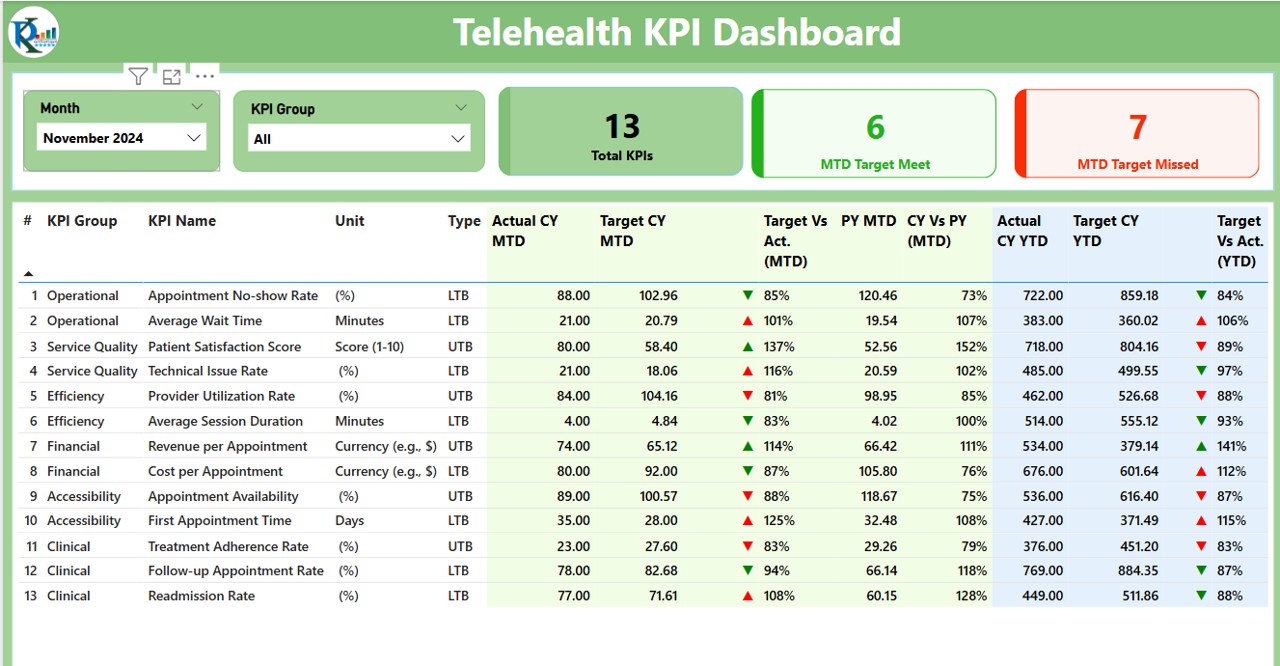
- Provides an overview of telehealth KPIs with slicers, performance indicators, and detailed KPI tables.
KPI Trend Page
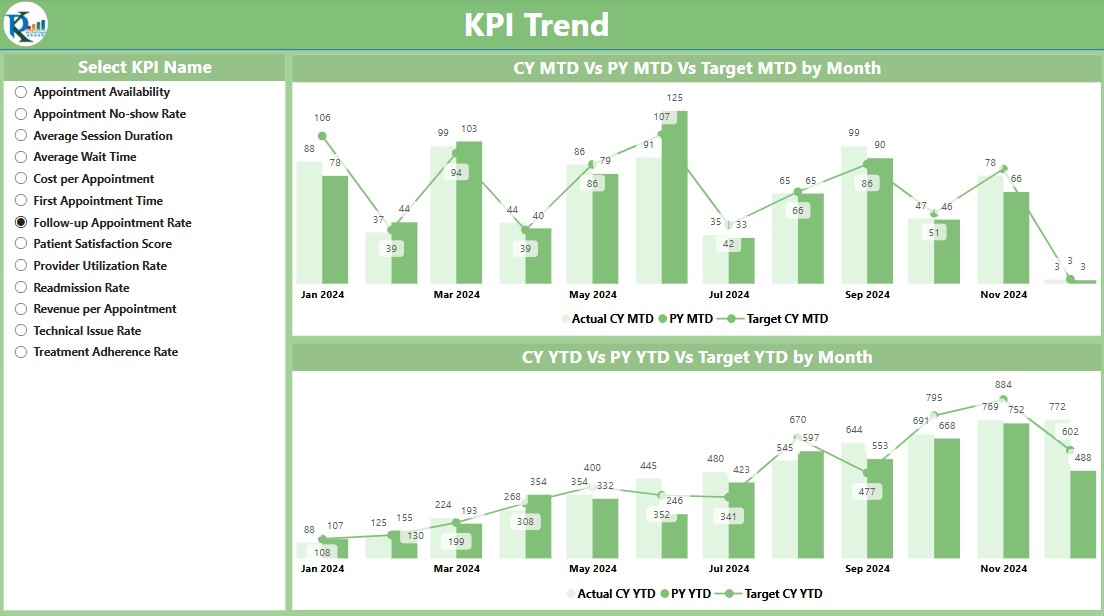
- Displays MTD and YTD comparisons using interactive combo charts for real-time trend analysis.
KPI Definition Page
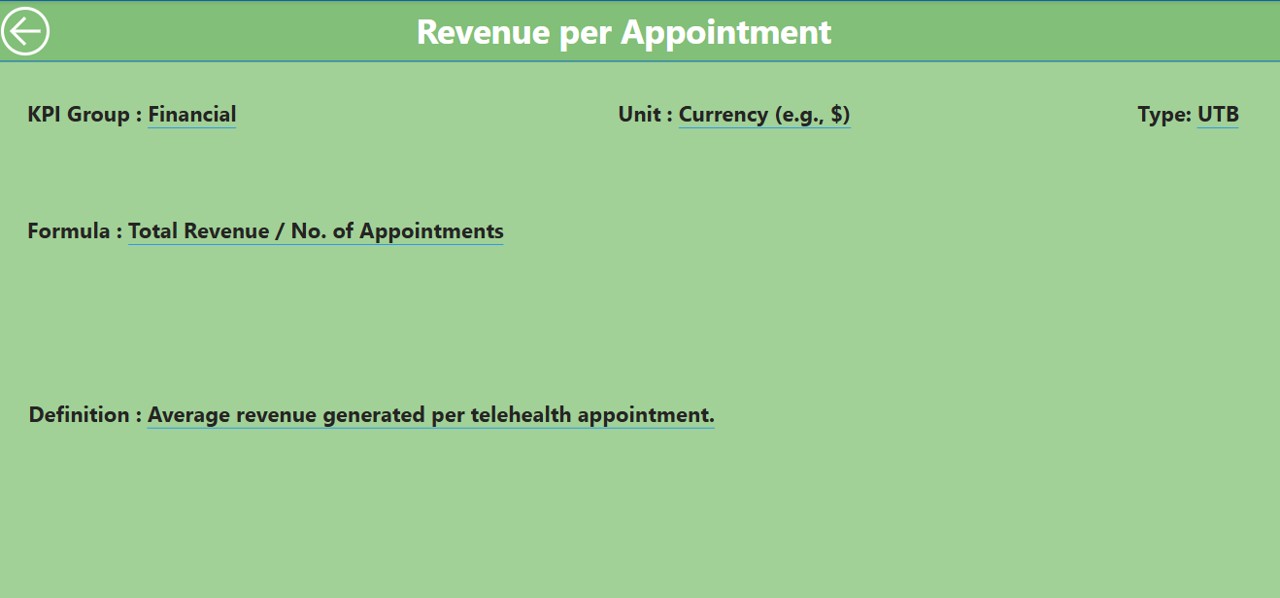
- A hidden drill-through page with KPI formulas and definitions for deeper insights.
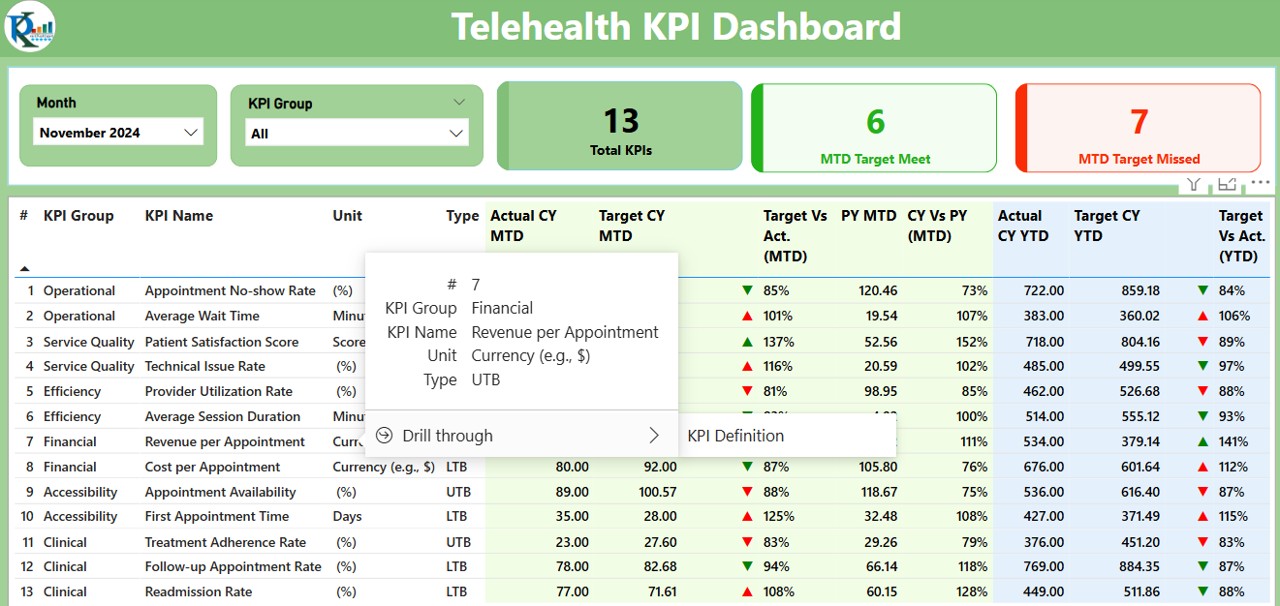
Dynamic Visual Indicators:
- Uses ▲ and ▼ icons with red/green colors to indicate KPI performance against targets.
- Compares actual vs. target values for both MTD and YTD metrics.
Excel-Based Data Input:
- Simple three-sheet data entry system to track actual values, target values, and KPI definitions.
- Seamlessly integrates with Power BI for automated updates and real-time tracking.
Interactive Slicers & Filters:
- Filter KPIs based on months and KPI groups for customized reporting.
- Drill-through functionality for in-depth KPI analysis.