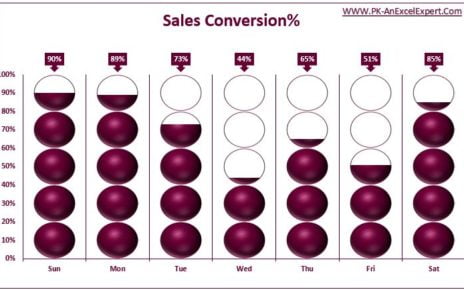
A beautiful data-driven Timer Chart visualization. This chart is perfect for displaying KPI metrics such as Service Level, Quality Score, and Sales Conversion. Using Excel Shapes and a Pie Chart, we have crafted a stunning visual that enhances your data presentation.

Key Features:
- KPI Metrics Display: Effectively showcase key performance indicators like Service Level, Quality Score, and Sales Conversion.
- Excel Shapes and Pie Chart: Combine the power of Excel Shapes and Pie Charts to create an engaging and informative Timer Chart.
- Data-Driven Visualization: Ensure your Timer Chart updates dynamically with changes in your data for accurate and up-to-date reporting.
Read the detailed blog post


