In today’s competitive corporate environment, training and development programs play a vital role in employee growth and organizational success. To optimize these programs, companies are turning to advanced business intelligence tools like Power BI. The Training and Development Dashboard in Power BI offers an efficient, real-time way to track and evaluate training programs, ensuring that organizations are meeting their employee development goals.
With this dynamic dashboard, HR managers and training professionals can gain in-depth insights into the effectiveness of their training initiatives, assess training costs, and monitor employee performance with ease.
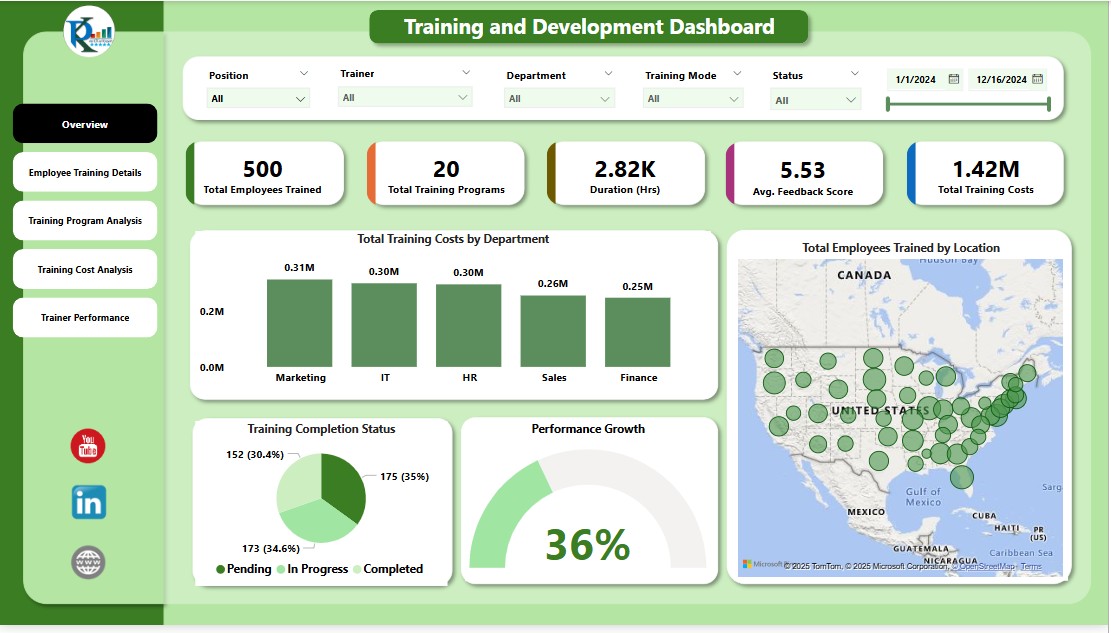
Key Features of the Training and Development Dashboard in Power BI
- Dynamic Overview Page: Get a quick snapshot of essential metrics such as total employees trained, training costs, performance growth, and more, with slicers and charts for easy filtering and visualization.
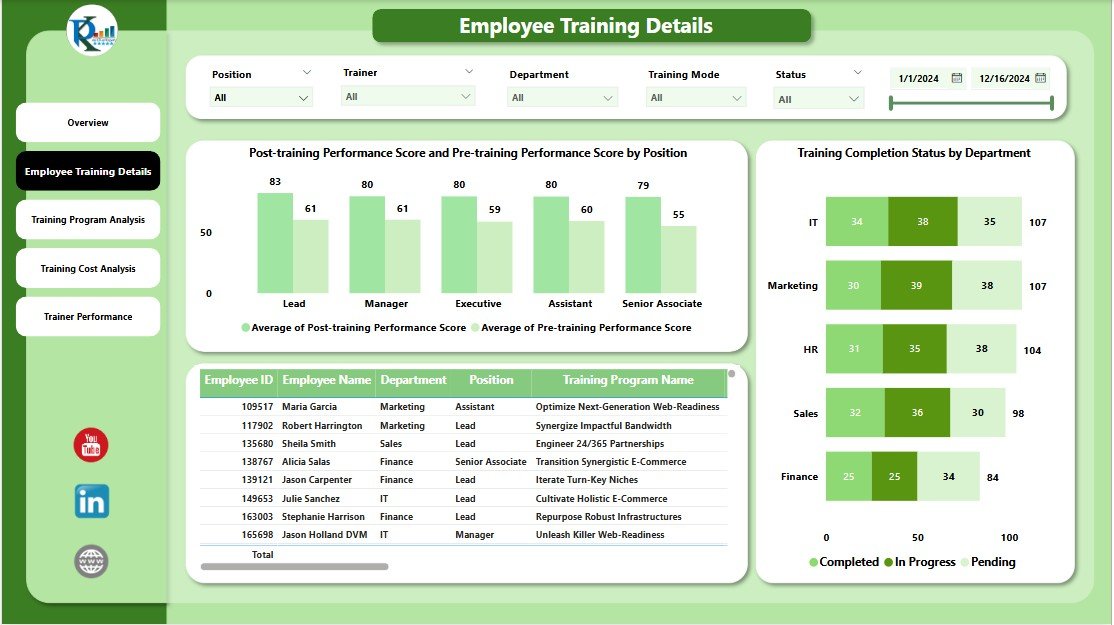
- Employee Training Details: Track individual training progress with detailed tables and charts, such as post-training vs. pre-training performance scores, training completion status, and department-specific insights.
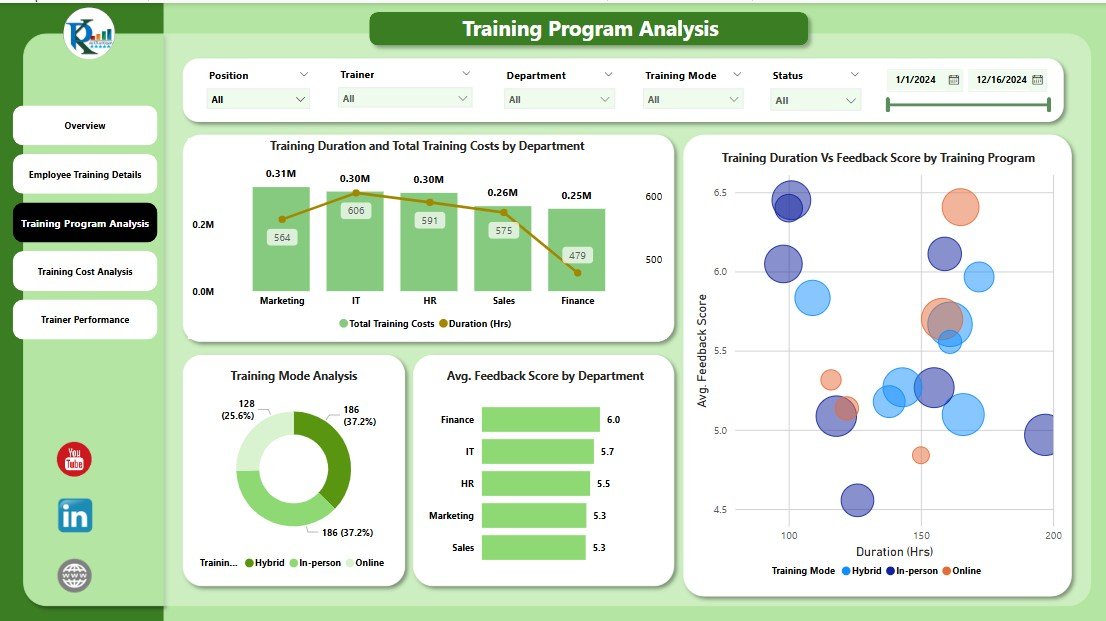
- Training Program Analysis: Analyze the effectiveness of training programs, with charts that compare training duration, feedback scores, and costs by department, helping you understand which programs deliver the best results.
- Training Cost Analysis: Evaluate the financial aspect of training, with tools to compare training costs across different departments, positions, and training modes.

- Trainer Performance Insights: Assess trainer effectiveness with visual charts that show performance growth versus costs by trainer and mode, helping you identify top-performing trainers and areas for improvement.

This dashboard allows you to track, analyze, and optimize every aspect of your organization’s training initiatives, making it an essential tool for improving employee engagement, performance, and ROI from training programs.