Unlock the full potential of your travel and tourism data with our Travel & Tourism KPI Dashboard in Power BI. This ready-to-use dashboard integrates seamlessly with Excel, offering a dynamic and intuitive interface to monitor and analyze critical performance indicators that drive business success in the tourism industry Travel & Tourism KPI Dashboard .
Key Features of the Dashboard:
Three Detailed Pages:
- Navigate through the Summary Page, KPI Trend Page, and a hidden KPI Definition Page, each designed for specific analytical needs.
Summary Page:
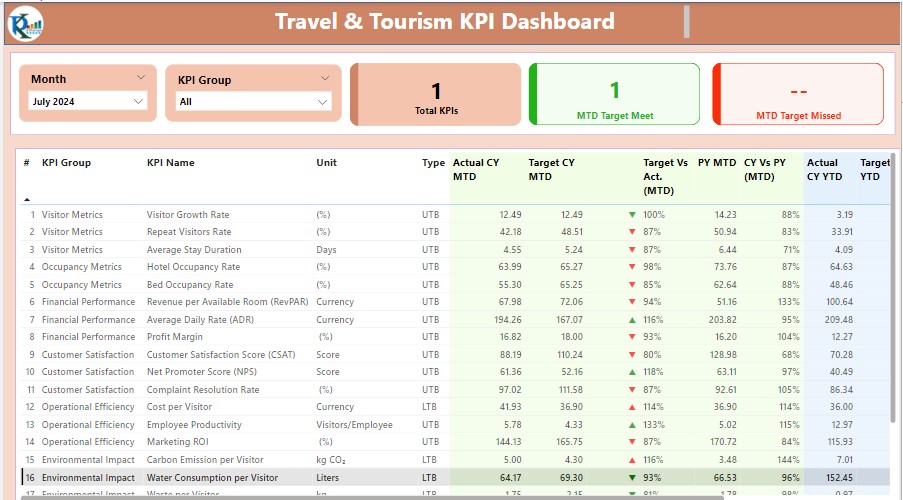
- Features dynamic slicers for Month and KPI Group, three informative cards for KPI counts, and detailed tables with extensive data on KPI performance, including actual vs. target metrics and year-over-year comparisons.
KPI Trend Page:
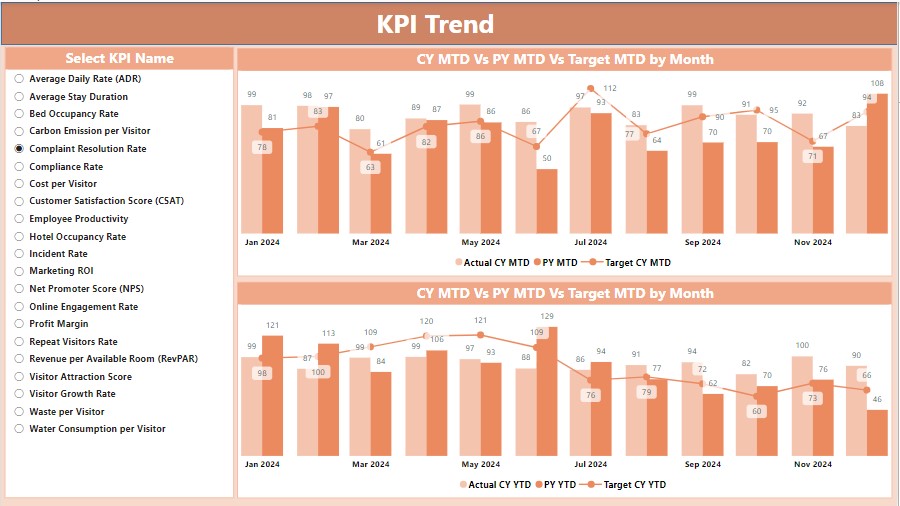
- Displays combo charts that visually compare Actual Numbers, Targets for MTD and YTD, and historical performance, enhanced by a slicer for selecting specific KPIs.
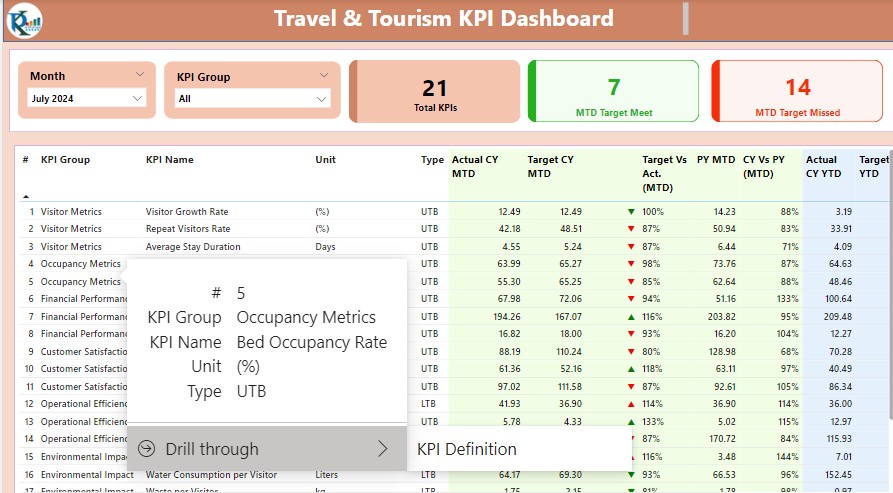
KPI Definition Page:
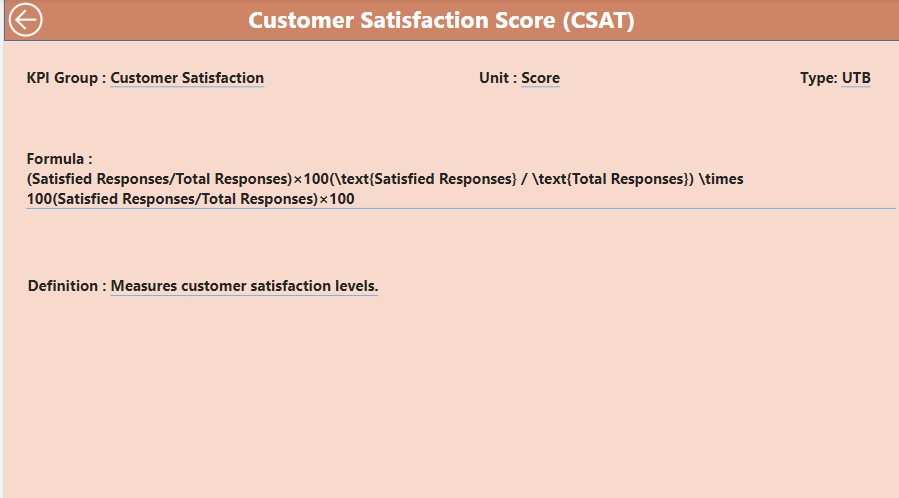
- A drill-through page for in-depth information on KPI formulas and definitions, accessible via a hidden interface for focused analysis.
Excel Integration:
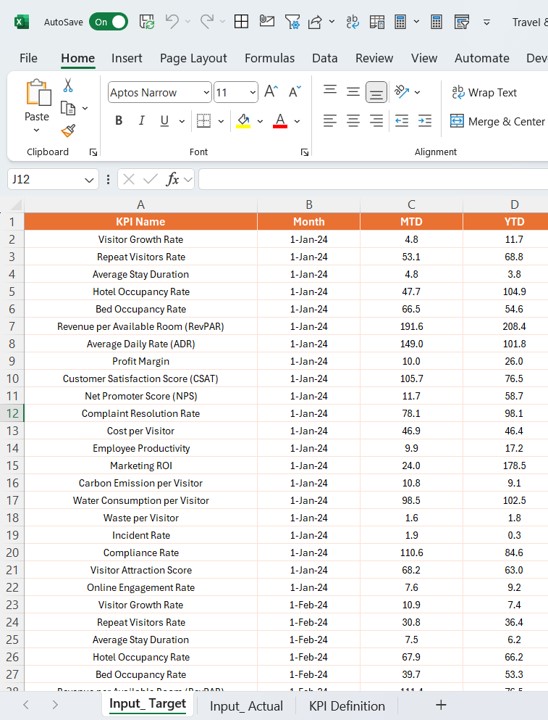
- Utilizes an Excel file as the data source with structured tabs for inputting actual numbers, target metrics, and detailed KPI definitions, ensuring all data points are up-to-date and accurately reflected in the dashboard.


