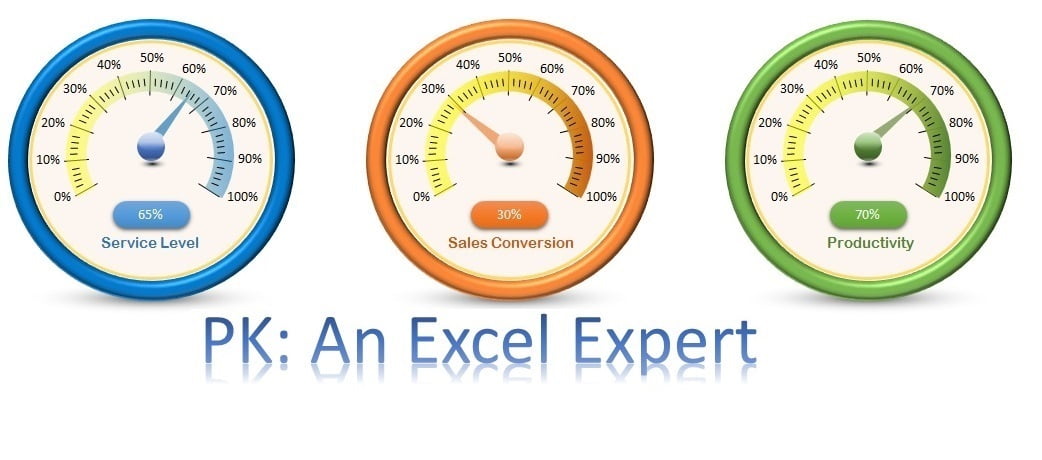
Rev up your data presentation with the “Ultimate Speedometer in Excel,” a powerful visual tool meticulously crafted to display performance metrics dynamically. Unlike traditional charts, this custom speedometer uses auto-shapes and VBA to offer a unique and engaging way to visualize data speeds and thresholds in real-time.
Key Features:
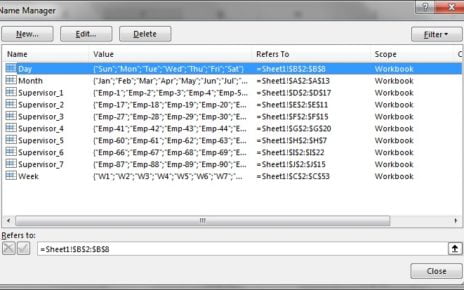
- Custom-Built Visualization: Crafted entirely with Excel auto-shapes and without the use of standard charts, providing a distinctive and tailored visual experience.
- Dynamic Needle Movement: Includes a finely tuned VBA script that reacts to changes in data, causing the speedometer needle to rotate accordingly, which mirrors real-time data fluctuations.
- Versatile Application: Perfect for tracking sales performance, financial targets, or any metric where speed and progress are key indicators, enhancing its utility across various business sectors.
Read the detailed blog post