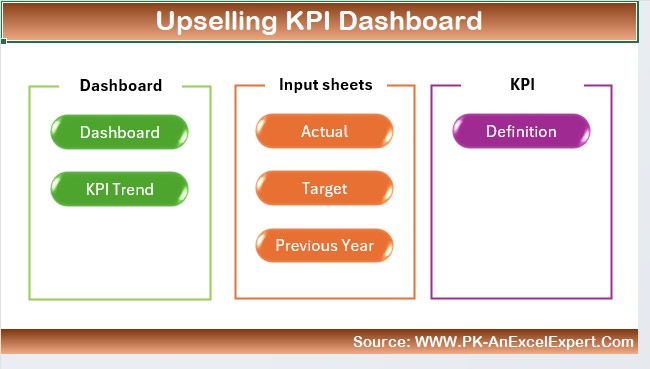
The Upselling KPI Dashboard in Excel is a powerful and user-friendly template designed to help businesses track and analyze upselling performance efficiently. This ready-to-use Excel dashboard provides a structured view of key metrics, enabling businesses to optimize their sales strategies and improve revenue growth. With automated calculations and interactive data visualization, this dashboard ensures accurate and real-time tracking of upselling KPIs.
Key Features of the Upselling KPI Dashboard in Excel:
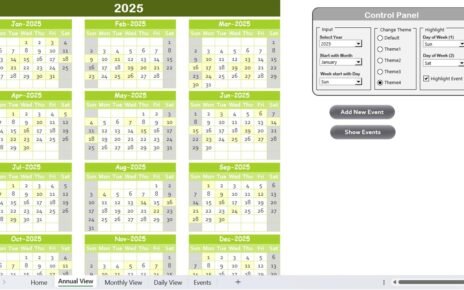
Home Sheet
A quick navigation hub with six buttons for seamless access to different sections of the dashboard.
Dashboard Sheet
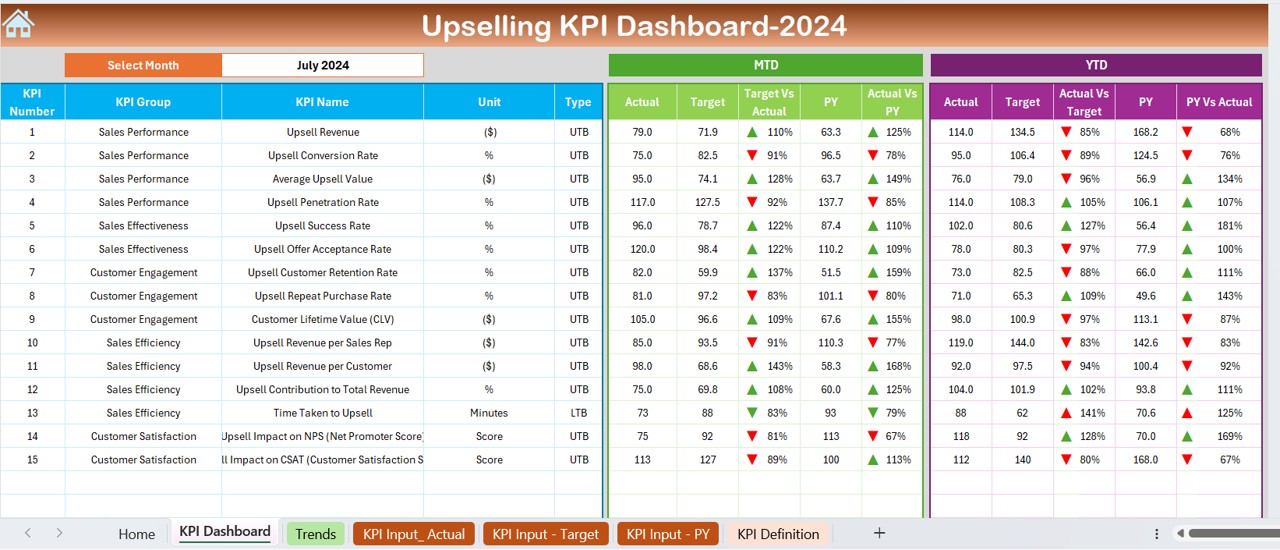
A dynamic KPI dashboard that updates automatically based on the selected month, displaying MTD and YTD data with conditional formatting for better insights.
KPI Trend Sheet
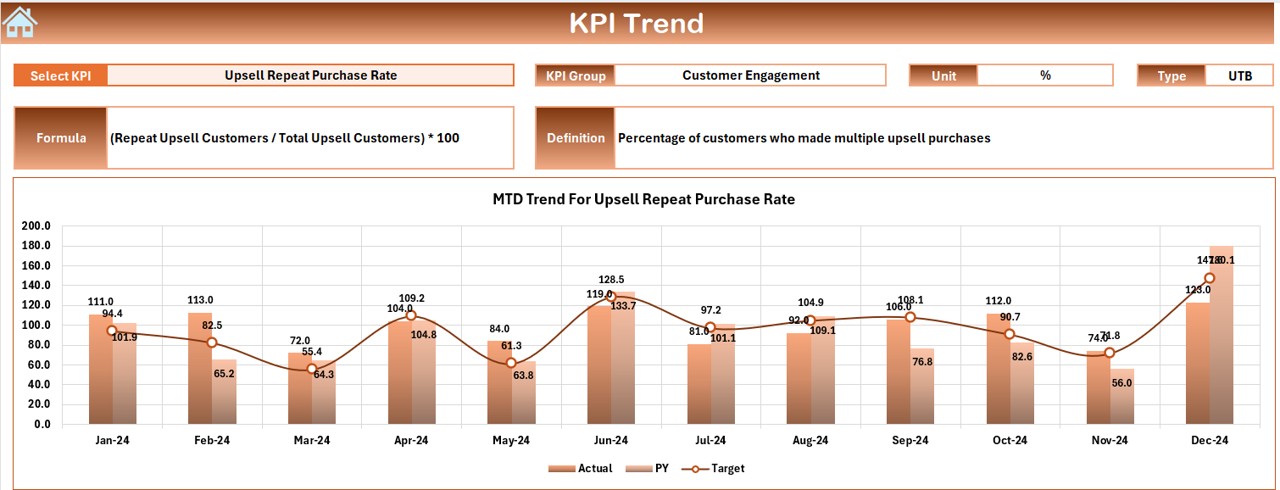
Select KPIs using a drop-down menu to view their unit, type, formula, and definition, along with MTD and YTD trend charts.
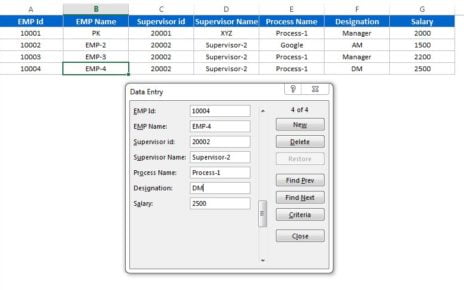
Actual Numbers Input Sheet
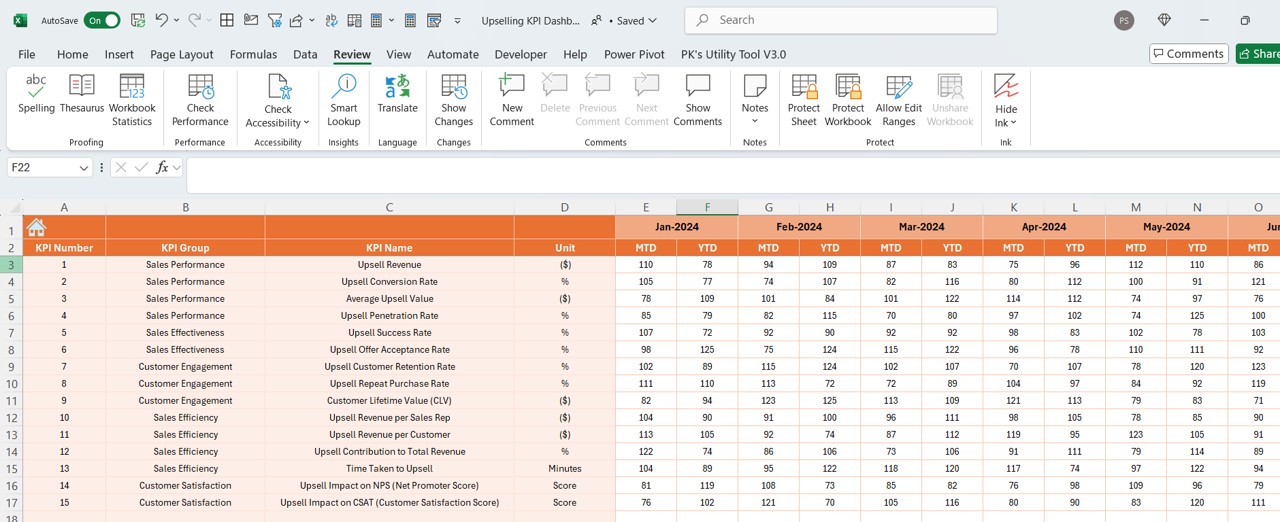
Enter actual sales performance data for each month with an easy-to-use input system.
Target Sheet
Define MTD and YTD targets for each KPI, aligning goals with actual performance.
Previous Year Numbers Sheet
Store last year’s performance data to compare trends and analyze improvements.
KPI Definition Sheet
Maintain a structured database of KPI names, groups, formulas, and definitions for better understanding and consistency.