A Video Marketing KPI Dashboard in Excel is an essential tool for tracking and managing your video marketing performance. This comprehensive template provides you with real-time insights into the effectiveness of your video campaigns, allowing you to monitor key performance indicators (KPIs) and optimize your content strategy accordingly. With this dashboard, you can track important metrics, compare current data with historical performance, and make informed decisions to improve your video marketing efforts.
Key Features of the Video Marketing KPI Dashboard
This ready-to-use Excel template is designed to help marketers effectively measure and manage their video marketing campaigns. It comes with 7 well-organized worksheets that provide all the necessary tools for tracking video performance:
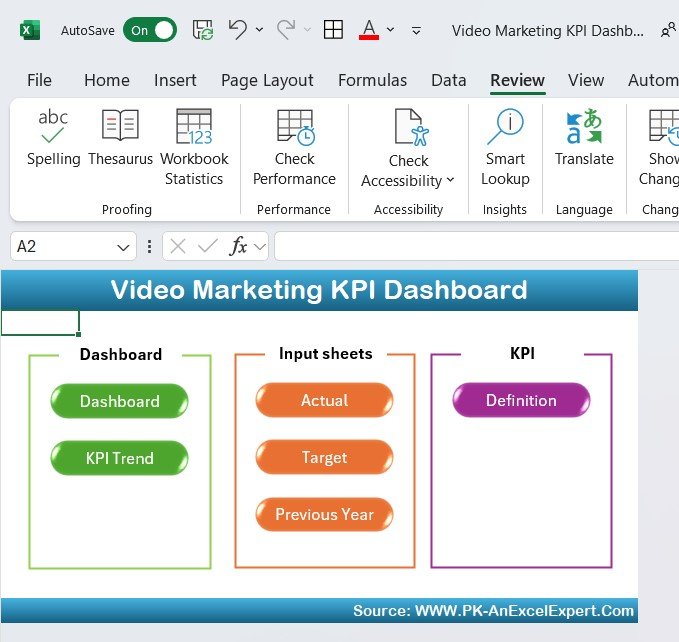
Home Sheet:
An index sheet with easy navigation buttons that link to the other six sheets, offering a clear overview of the entire dashboard.
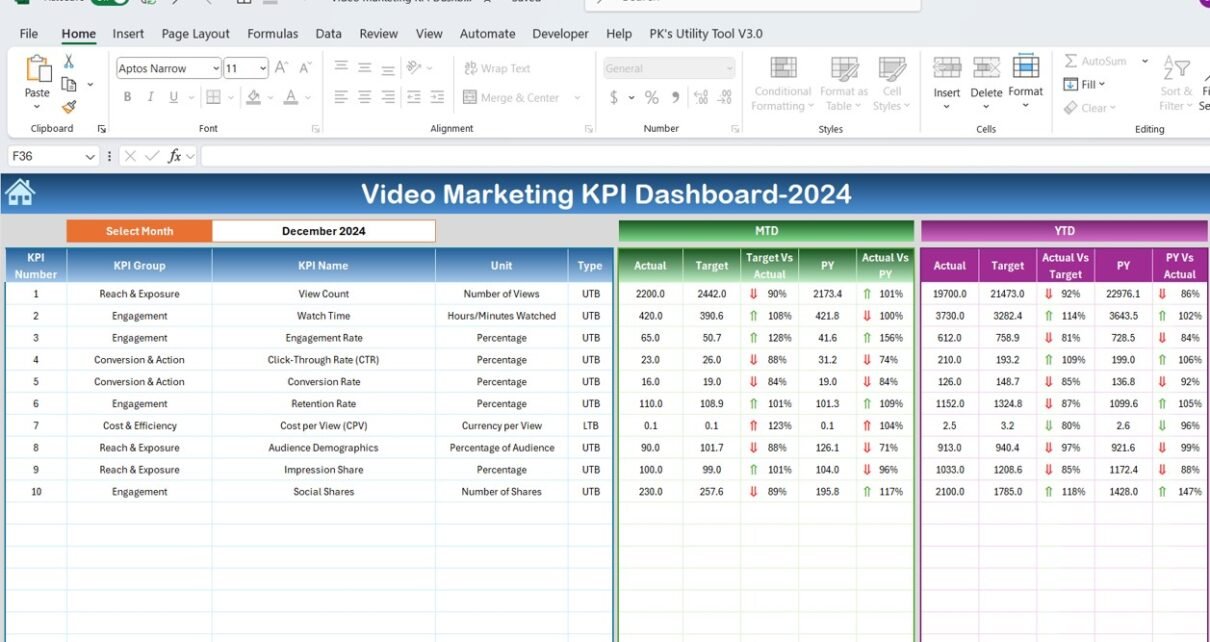
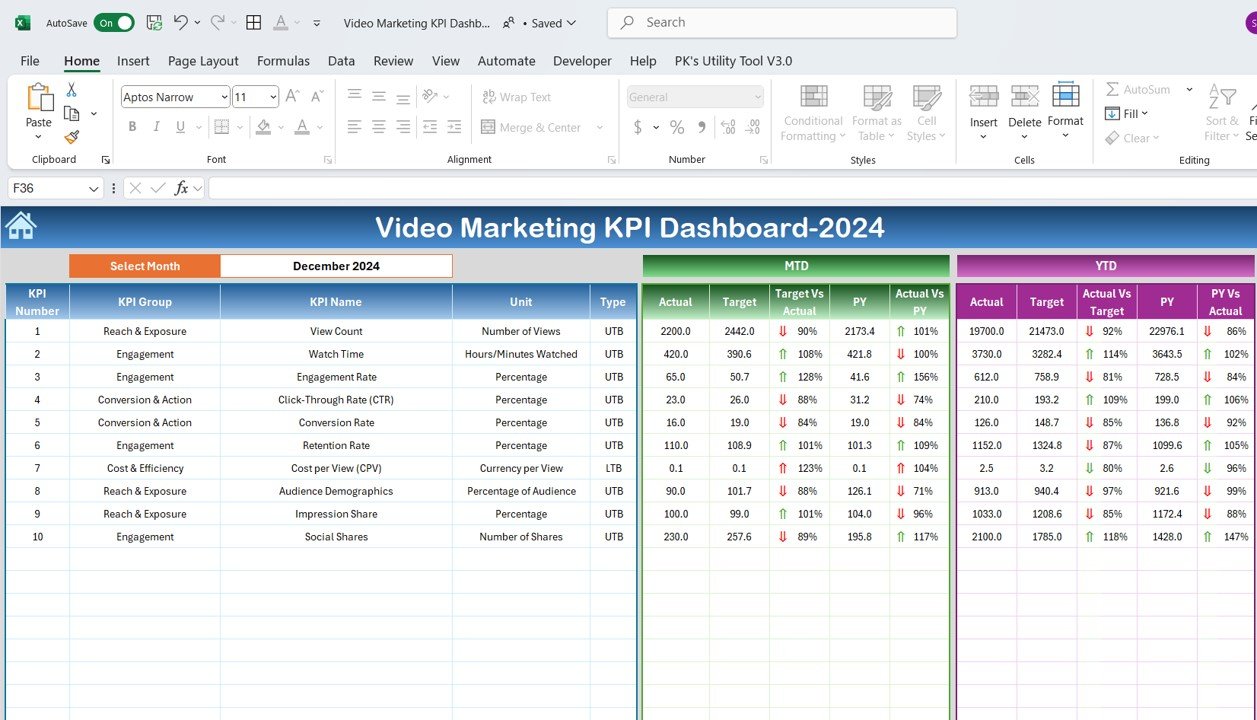
Dashboard Sheet Tab:
The core of the dashboard, where you can view KPIs for the selected month. This sheet displays MTD (Month-to-Date) and YTD (Year-to-Date) data, with comparisons against targets and previous year’s figures.
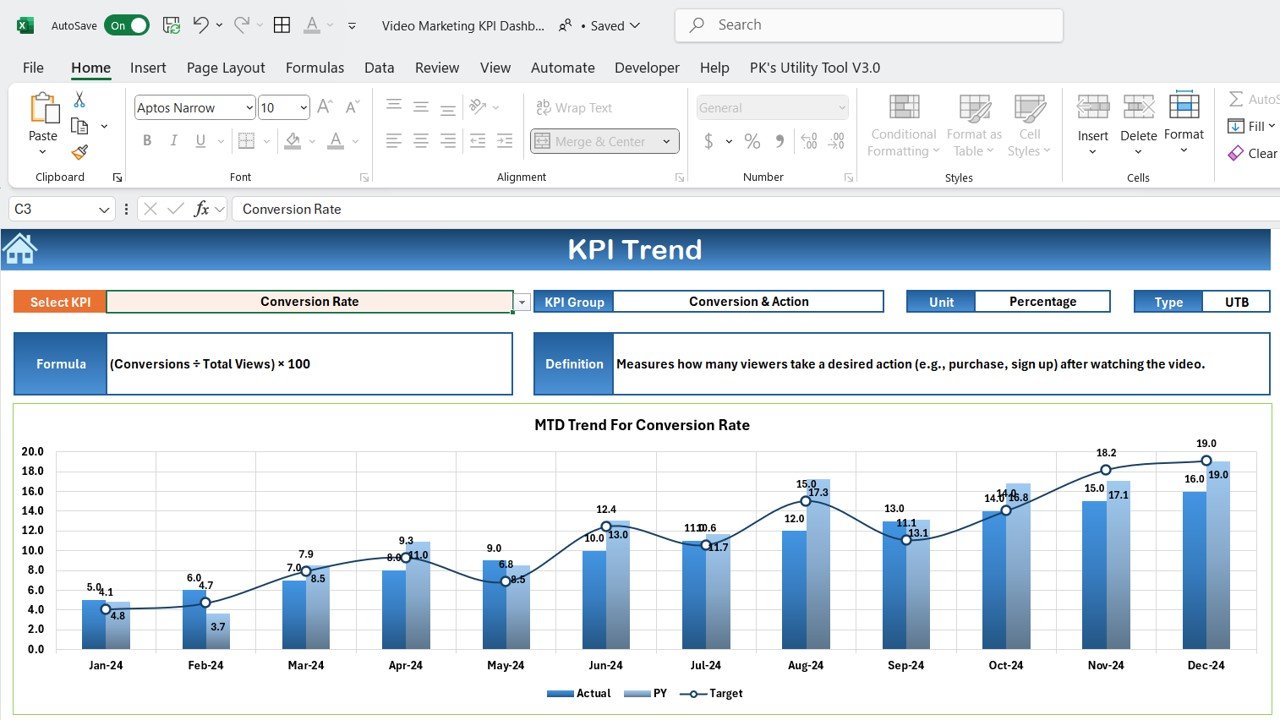
KPI Trend Sheet Tab:
A sheet for tracking specific KPIs over time, showing each KPI’s group, unit, formula, and definition, making it easier to understand what each metric means.
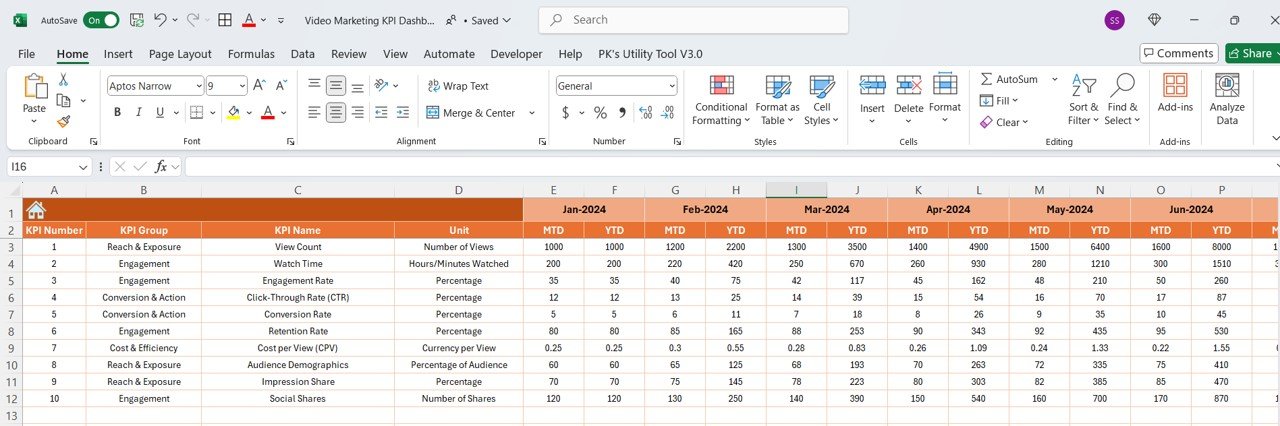
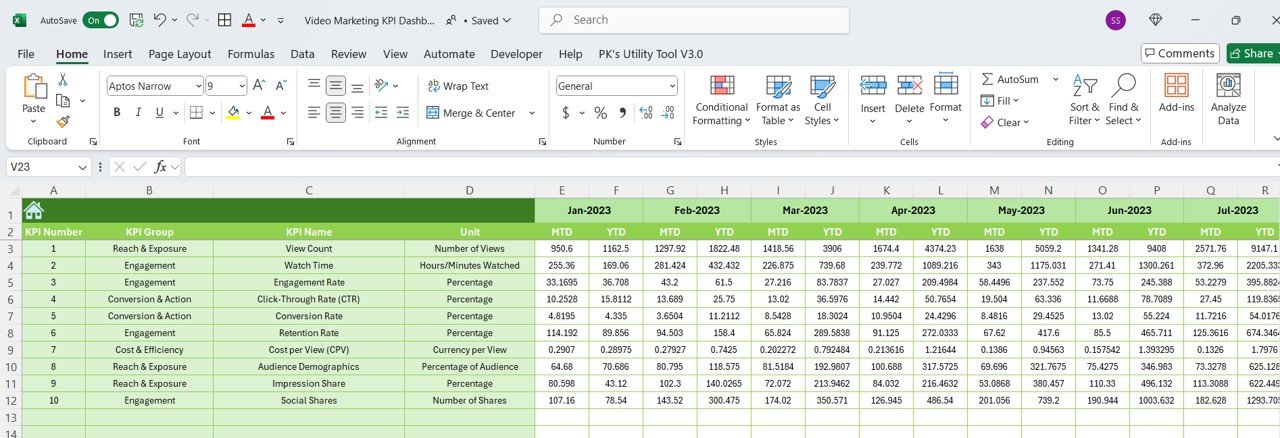
Actual Number Sheet Tab:
A place where you can input actual data for MTD and YTD for the selected month, which updates automatically when the month is changed.
Target Sheet Tab:
Allows you to input target figures for each KPI, helping you track progress against goals.
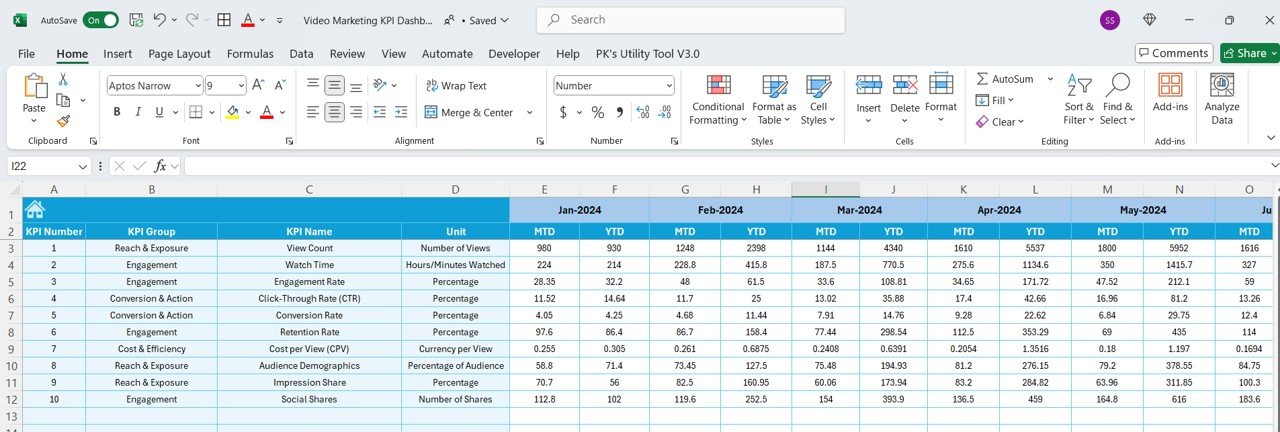
Previous Year Number Sheet Tab:
Input previous year’s data for comparison, allowing you to assess year-over-year performance.
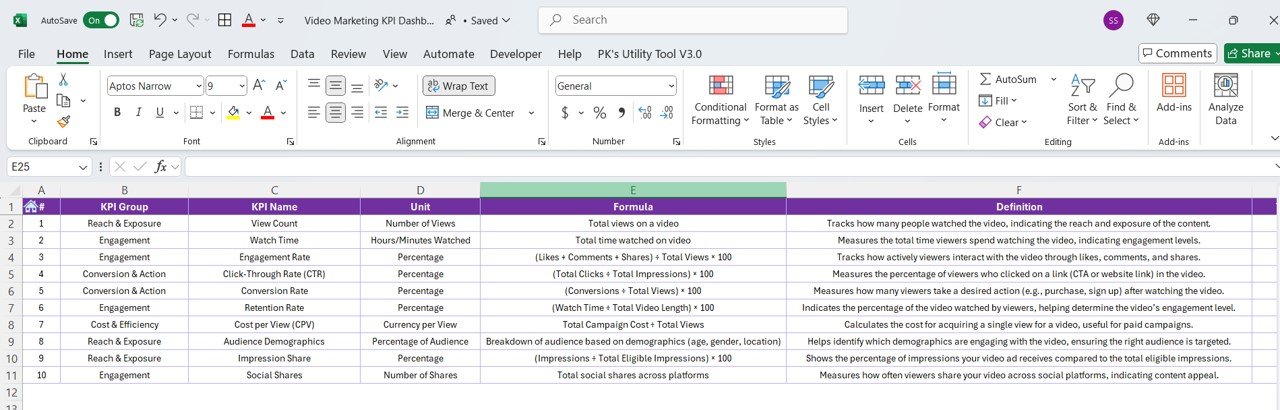
KPI Definition Sheet Tab:
Provides detailed information on each KPI, including its name, unit of measurement, formula, and definition for accurate data entry.’