Maximize your operational efficiency with our ready-to-use Waste Management KPI Dashboard, designed specifically for Power BI. This comprehensive tool captures essential data in an Excel file and displays it through an interactive, user-friendly interface in Power BI, allowing you to monitor and manage your waste management metrics effectively.
Key Features of the Waste Management KPI Dashboard:
Summary Page:
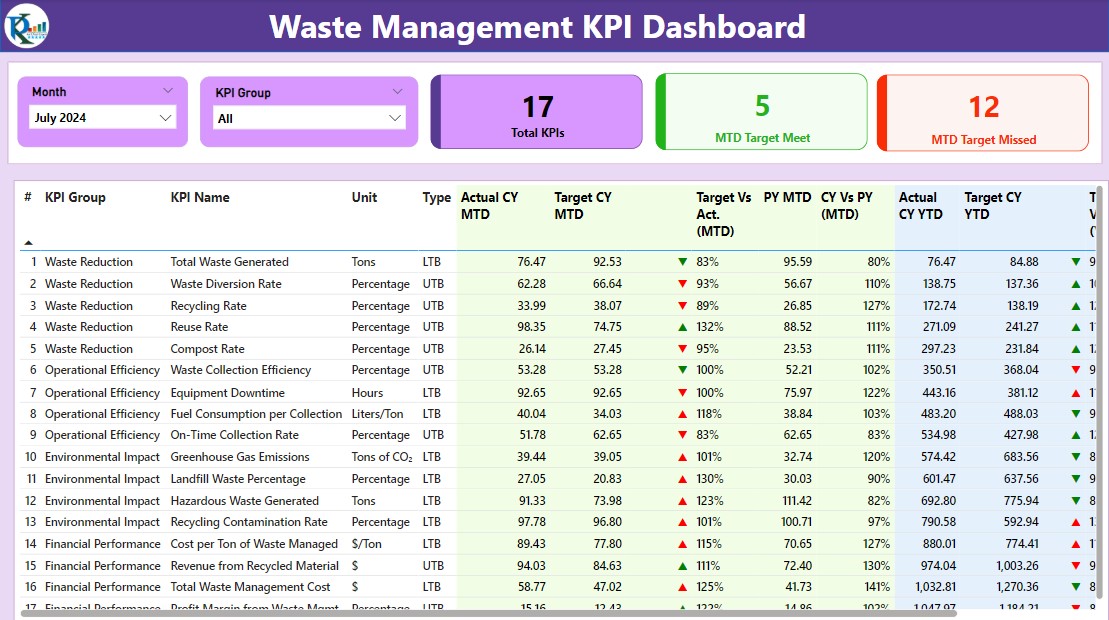
- Interactive Slicers: Quickly filter data by Month and KPI Group to view specific metrics.
- Performance Cards: Track the Total KPIs count, MTD Target Meet count, and MTD Target Missed count.
- Detailed Metrics Table: Includes critical information such as KPI Number, Name, Group, Unit, Type (LTB or UTB), and performance comparisons like Actual vs. Target for current and previous years, displayed with intuitive ▼and ▲ icons for quick status recognition.
KPI Trend Page:
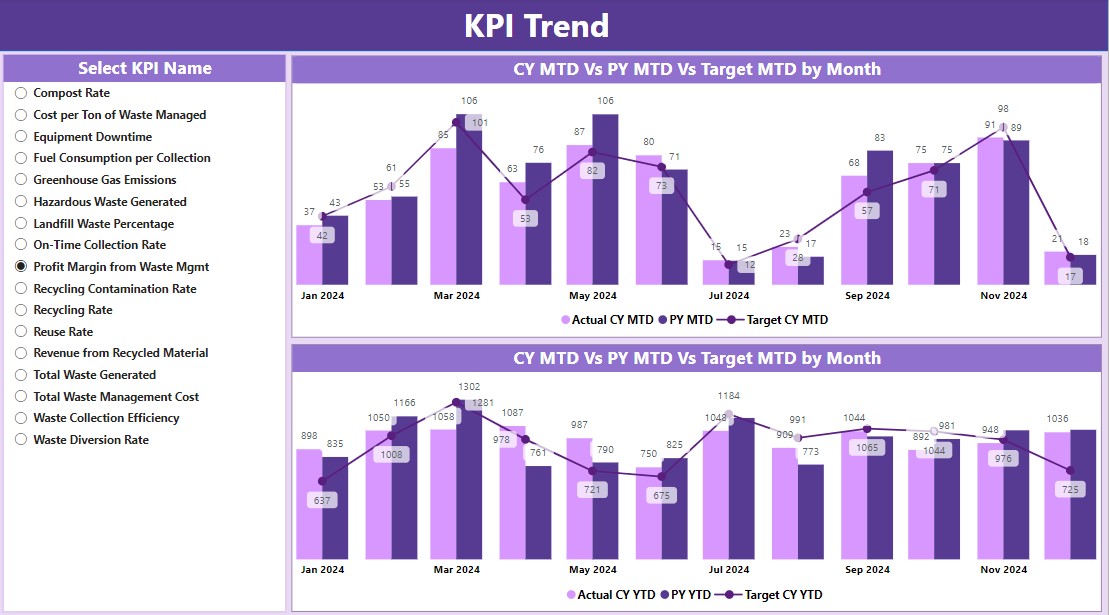
- Dual Combo Charts: Visualize the Actual Numbers, Previous Year’s performance, and Targets for both MTD and YTD.
- KPI Selector: Utilize the slicer to choose and analyze specific KPI trends.
KPI Definition Page:
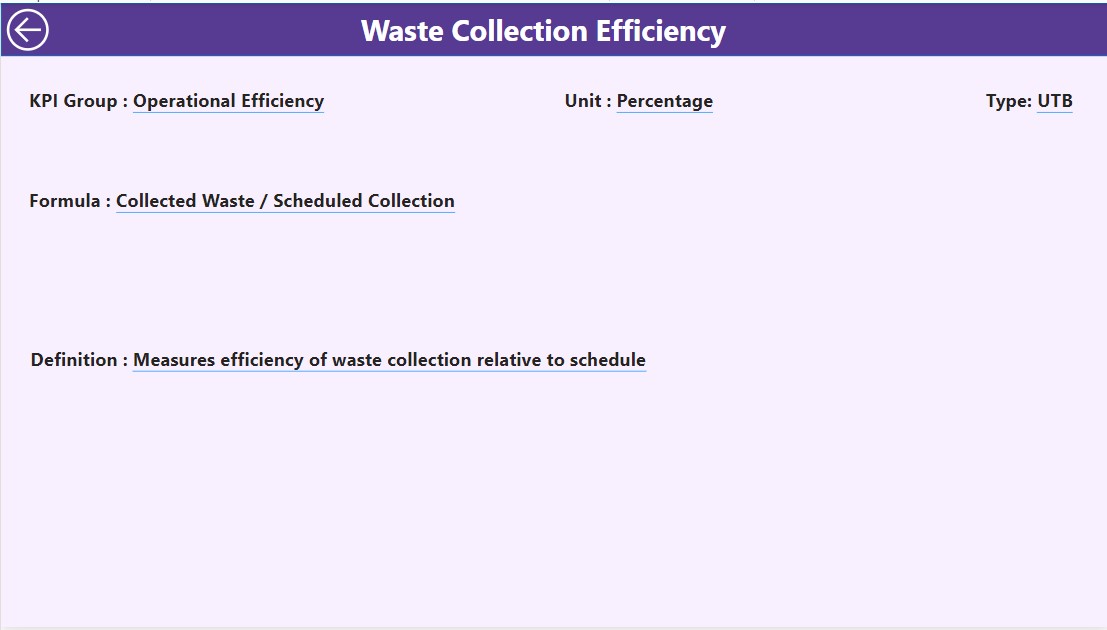
- Drill-through Functionality: Access a hidden page with detailed KPI definitions and formulas from the summary page, enhancing the understanding and accuracy of data interpretation.
Excel Data Integration:
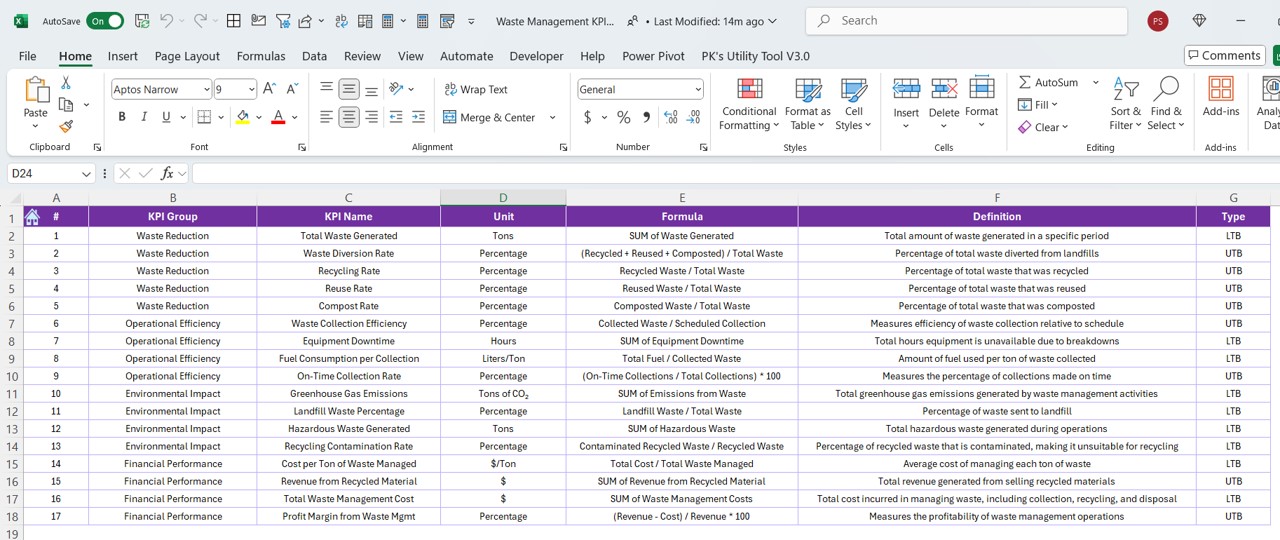
- Seamlessly integrates with an Excel file comprising three worksheets for Actual Numbers, Target Numbers, and KPI Definitions, ensuring all data is up-to-date and easily manageable.